Content
Published:
This is an archived release.
Road traffic behind rising greenhouse gas emissions
Emissions of greenhouse gases from road traffic in the municipalities have increased by 31 per cent since 1991. There has been an increase in almost all municipalities, and both transport of people and goods have increased. Despite the growth in traffic, the emissions of NOX have declined considerably, owing to decreased emissions from vehicles.
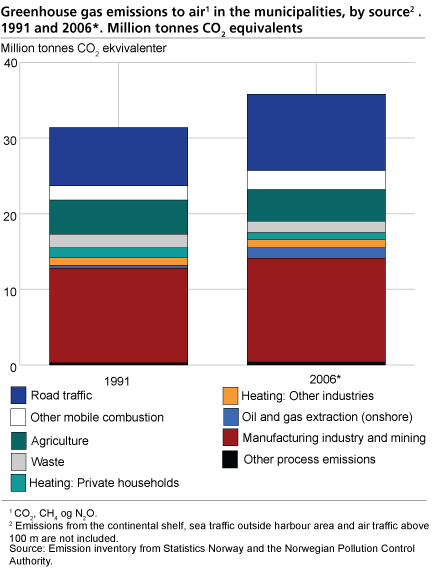
In 2006, emissions of the three most important greenhouse gases carbon dioxide (CO2), methane (CH4) and nitrous oxide (N2O) from municipalities amounted to almost 36 million tonnes. This accounted for 69 per cent of Norway’s total emissions of these gases. The remainder was emitted from oil and gas activities on the continental shelf, the maritime zones and airspace (over 100 m altitude). This is an increase of more than 4.3 million tonnes CO2 equivalents, or 14 per cent, since 1991. In 166 of Norway’s 431 municipalities the relative growth in greenhouse gas emissions has been higher than that of all municipalities. In 103 municipalities, the emissions have been reduced, and in three of these by more than 50 per cent. Emissions of fluoride gases are not included in these figures, see Text box .
The most important sources of emission to air of greenhouse gases in the municipalities are the manufacturing industry, road traffic and agriculture (see Figure 1). These accounted for 14, 10 and 4 million tonnes CO2 equivalents respectively in 2006. Emissions from road traffic increased by 2.4 million tonnes, and were the main reason for the growth.
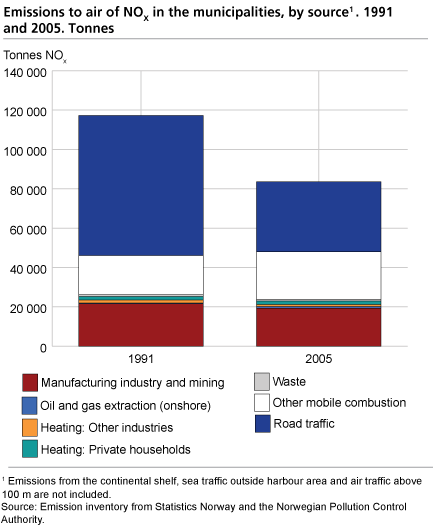
Emissions of non-greenhouse gases distributed by municipality do not necessarily follow the same pattern. For instance, the emissions of NOX were reduced by 29 per cent in the municipalities to slightly less than 84 000 tonnes in 2005. The emissions of NOX in the municipalities only account for 44 per cent of the total emissions. Emissions of NOX in the municipalities are dominated by three sources: manufacturing industry (23 per cent), road traffic (43 per cent) and other mobile combustion (29 per cent) (see Figure 2). While the emissions from the first two have been reduced by 11 and 50 per cent respectively since 1991, the emissions from other mobile sources have increased by 22 per cent.
Each municipality has its own story
There are great differences between the municipalities, both with regard to the size of the emissions, how the emissions have developed over time and the source of the emissions. Table 1 contains an overview of the sources with the largest contribution to the emission of greenhouse gases in the municipalities in 1991 and 2006 and for NOX in 2005.
| Greenhouse gases | NOX | ||||||||||||||||||||||||||||||||||||||
|---|---|---|---|---|---|---|---|---|---|---|---|---|---|---|---|---|---|---|---|---|---|---|---|---|---|---|---|---|---|---|---|---|---|---|---|---|---|---|---|
| 1991 | 2006* | 2005 | |||||||||||||||||||||||||||||||||||||
| Road traffic | 201 | 256 | 229 | ||||||||||||||||||||||||||||||||||||
| Other mobile combustion | 13 | 19 | 171 | ||||||||||||||||||||||||||||||||||||
| Agriculture | 176 | 117 | . | ||||||||||||||||||||||||||||||||||||
| Waste | 3 | 3 | 0 | ||||||||||||||||||||||||||||||||||||
| Heating, exclusive manufacturing industries | 1 | 0 | 0 | ||||||||||||||||||||||||||||||||||||
| Oil and gas extraction (onshore installations) | 2 | 2 | 2 | ||||||||||||||||||||||||||||||||||||
| Manufacturing and mining | 39 | 37 | 29 | ||||||||||||||||||||||||||||||||||||
| 1 | The NOx emissions are not distributed by source for 1991 because of uncertainty in the data material. |
| Source: Emission inventory from Statistics Norway and the Norwegian Pollution Control Authority. | |
The sources that dominate the emissions in a municipality are highly dependent on the industrial structure of the municipality. The manufacturing industry contributed to almost 40 per cent of total emissions of the three most important greenhouse gases in the municipalities in 2006. However, these emissions were not evenly distributed. In 12 municipalities, manufacturing mining industries contributed to more than 90 per cent of the emissions, while in 363 municipalities this industry contributed to less than 10 per cent. In 71 municipalities, greenhouse gas emissions from the manufacturing industry more than doubled between 1991 and 2006, while more than half of the municipalities experienced a reduction in emissions from the manufacturing industry.
In several municipalities, agriculture is a considerable source of greenhouse gas emissions, even though the total contribution from agriculture was 12 per cent in 2006. In 47 municipalities, agriculture contributed to more than half of the greenhouse gas emissions.
Municipalities with big landfills can have considerable emissions of landfill gas (CH4). However, the waste that causes theses emissions may also originate from other municipalities in the area.
Road traffic accounted for about 28 per cent of the three main greenhouse gases in 2006. Road traffic is by far the most important reason for the increase in the emissions of these gases.
Related material on the municipal figures:
About the municipal figuresThe statistics cover the greenhouse gases carbon dioxide (CO2), methane (CH4) and nitrous oxide (N2O), whereas HFCs, PFCs and SF6 not are included. Also figures for emissions of NOX, SO2, NH3, PM1 0 and NMVOC are included.
The statistics include only three out of six greenhouse gases covered by the Kyoto Protocol. In 2005, these three greenhouse gases contributed to 97 per cent of total Norwegian emissions of greenhouse gases. The coverage of less than 100 per cent is a marginal source of error for most municipalities. However, for municipalities with industries manufacturing aluminium or magnesium, emissions of other greenhouse gases, namely PFCs and SF6, will have a significant impact on the overall trend. This must be taken into consideration when emission figures are interpreted. Emissions of PFCs and SF6 have been reduced by about 4 million tonnes CO2 equivalents on a national level since 1990. In this article, only carbon dioxide, methane and nitrous oxide are included in the collective term greenhouse gases.
All figures on emissions of greenhouse gases published by Statistics Norway are consistent with the requirements of the UN Climate Convention and the Kyoto Protocol. Therefore, foreign shipping and foreign air traffic are not included. Furthermore, the figures for municipalities differ from the national figures in that they do not include emissions from oil and gas activities and domestic shipping and fishing outside ports.
In addition to the publication of preliminary figures on greenhouse gas emissions for 2006 and final figures for 2005, updated figures for emissions in municipalities are presented for 1991, 1995 and 2000. Municipality figures for 1990, which is the base year for the Kyoto protocol, are not available.
The quality of the municipal figures is in some cases poorer than the corresponding emission figures for the entire country. This is because the knowledge about for instance consumption of different energy carriers is better at national level than at municipal level. It should therefore be kept in mind that the figures presented may contain errors and do not always present a precise picture of the development in a single municipality. |
Annual recalculationAs the emission figures are mainly based on calculations, there is always room for improvement. The research on emissions to air is reviewed annually, leading to an annual recalculation of the entire time series. Such modifications are often of less importance for the total emission level in Norway, but may be of great significance for some municipalities. Furthermore, following the recalculations, previously published figures for municipalities are no longer valid and must therefore not be compared to the latest figures. Figures in the tables linked to this web page are always up to date. |
The statistics is published with Emissions to air.
Contact
-
Statistics Norway's Information Centre
E-mail: informasjon@ssb.no
tel.: (+47) 21 09 46 42


