Content
Published:
This is an archived release.
Road traffic led to increased greenhouse gas emissions
Emissions of greenhouse gases in Norwegian municipalities have increased by 13 per cent since 1991. In many municipalities, increased road traffic is the main reason for this growth, but manufacturing industries also contribute significantly.
These are some of the findings of Statistics Norway and the Norwegian Pollution Control Authority in their calculation of greenhouse gas emissions. Figures for each of the municipalities can be downloaded from StatBank Norway.
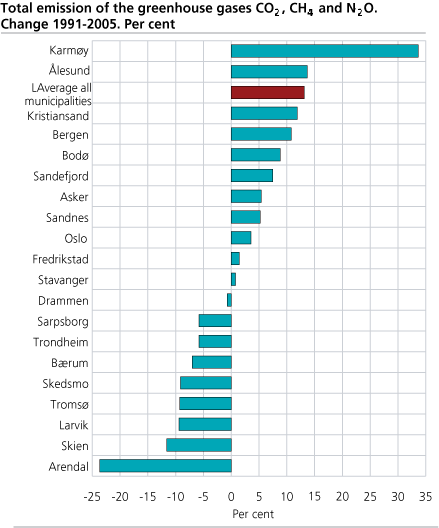
Emissions of greenhouse gases in Norwegian municipalities increased by 13 per cent from 1991 to 2005. The figures include CO2, CH4 and N2O only, not the other gases covered by the Kyoto Protocol: HFCs, PFCs and SF6(see box About the statistics). For most municipalities, the growth is caused primarily by increases in emissions from road traffic, which increased by 28 per cent in this period. Some municipalities have also experienced considerable increases in process emissions from manufacturing industries. Whereas emissions attributed to road traffic have increased wherever there is traffic, emissions from manufacturing industries mostly occur in a two-digit number of municipalities with emission-intensive plants. However, the growth in emissions has been somewhat counteracted, i.a. by reductions in the use of oil for heating. Furthermore, emissions from landfills decreased significantly from 1991 to 2005 (i.a. due to emission-reducing measures such as utilising and flaring of methane, as well as increased incineration of waste instead of deposition in landfills).
From 2004 to 2005, average emissions decreased in many municipalities. The most common causes of the decline were reduced use of heating oil and lower production in some manufacturing industries. The reduction in sales of heating oil can be attributed to the price relation between oil and electricity, climatic conditions etc, but may also to some extent be a result of increased user preference for burning wood or wood pellets or use of district heating.
Industrial structure and community size decisive
As mentioned, road traffic was the main cause of growth in emissions of greenhouse gases, and it was this source that contributed most to the total emissions in the greater part of the municipalities in 2005. The significance of the various emission sources in a given municipality depends on the industrial structure. In general, large cities have fewer emission-intensive industries and little agriculture, making road traffic and heating major emission sources. In some smaller municipalities with large industries or typical agricultural municipalities, emissions from these sources often dominate. For municipalities with landfills, emissions from this source will also be noticeable.
Our results show that emissions from road traffic and waste treatment vary considerably among municipalities. The large cities generally have lower per capita emissions from these sources. For instance, in large cities the passage share of road traffic is generally low, leading to reduced emissions from road traffic. Furthermore, several populous municipalities have waste incineration plants, resulting in less emission of methane than would be the case if the waste had been deposited in landfills. For more sparsely populated municipalities there is no obvious pattern. Some have high emissions due to landfills or traffic going through the municpality, while others have very low emissions.
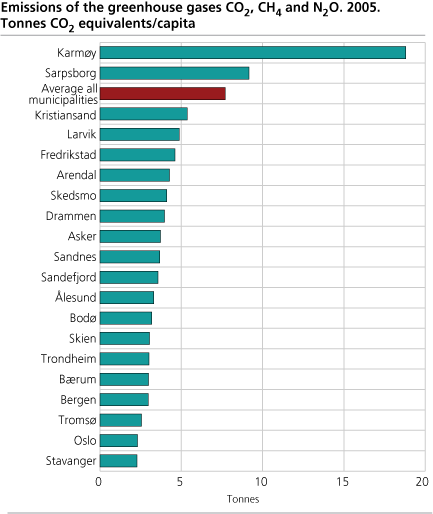
Eight tonnes of greenhouse gases per person
If we add together the emissions in all the municipalities and divide it by number of citizens, the average emission was nearly 8 tonnes of CO2 equivalents per capita in 2005. This figure does not include emissions from oil and gas activities, domestic shipping and fishing outside ports and international sea and air traffic (see box About the statistics). In 167 municipalities, per capita emissions were higher than average, while in 267 municipalities emissions were lower. There are substantial differences in emission level between municipalities, from 2 tonnes per capita in Oppegård to 193 tonnes in Tysfjord. Out of the 20 most populous municipalities, only Karmøy and Sarpsborg have above average emissions per capita in 2005. What distinguishes these two municipalities from the other 18 is that they have emission-intensive industry.
To a great extent, emissions from populous municipalities and cities also had lower a growth rate than the rest of the country. While emissions from Norwegian municipalities on average increased by 13 per cent from 1991 to 2005, only to of the 20 most populous municipalities had a higher growth.
|
Municipal figures
The statistics cover the greenhouse gases carbon dioxide (CO2), methane (CH4) and nitrous oxide (N2O), whereas HFCs, PFCs and SF6 not are included. Also figures for emissions of NOx, SO2, NH3, PM10 and NMVOC are presented. The statistics include only three out of six greenhouse gases covered by the Kyoto Protocol. In 2005, these three greenhouse gases contributed to 97 per cent of the total Norwegian emissions of greenhouse gases. The coverage of less than 100 per cent is a marginal source of error for most municipalities. However, for municipalities with industries manufacturing aluminium or magnesium (e.g. Karmøy - one of the 20 most populous), emissions of other greenhouse gases, namely PFCs and SF6, will have a significant impact on the overall trend. This must be taken into consideration when emission figures are interpreted. Emissions of PFCs and SF6 have been reduced by about 4 million tonnes CO2-equvivalents on a national level since 1990. In our article, only carbon dioxide, methane and nitrous oxide are included in the collective term greenhouse gases. All figures on emissions of greenhouse gases published by Statistics Norway are consistent with the requirements of the UN Climate Convention and the Kyoto Protocol. Therefore, foreign shipping and foreign air traffic are not included. The figures for the municipalities are furthermore different from the national figures in that they do not include emissions from oil and gas activities and domestic shipping and fishing outside ports. In addition to the publication of preliminary figures on greenhouse gas emissions for 2005 and final figures for 2004, updated figures for emissions in municipalities are presented for 1991, 1995 and 2000. Municipality figures for 1990, which is the base year for the Kyoto protocol, are not available. |
Annual recalculation
As the emission figures mainly are based on calculations, and thus not are exact values, there is always room for improvement. Research relating to emissions to air is reviewed annually, leading to an annual recalculation of the whole time series. Such modifications are often of less importance for the total emission level in Norway, but may be of great significance for some municipalities. Furthermore, following the recalculations, previously published figures for municipalities are no longer valid and must therefore not be compared to the latest figures. Figures in the tables linked in this web page will always be up to date.
Documentation
National greenhouse gas emissions: Temporary reduction in emissions of greenhouse gases
Tables
Figures for each municipality can be found in StatBank Norway.
|
Local emissions to air
In addition to figures on emissions of greenhouse gases, we publish figures on emissions that contribute to local air pollution, allocated to municipalities. Emissions of particulate matter (PM10) and nitrogen oxides (NOx) reduce local air quality in many places in Norway every year. Fuel wood use, exhaust from road traffic and road dust are generally the most important sources of particulate matter. For nitrogen oxides, road traffic cause on average about half of the emissions in Norwegian municipalities. These emissions have been greatly reduced throughout the 1990s, after the use of catalytic converters was made mandatory in petrol-powered vehicles in 1989. In some municipalities, manufacturing industry and domestic shipping are important sources of emissions of nitrogen oxides.
Emissions of particulate matter from fuel wood use
As mentioned, fuel wood use is an important source of emissions of particulate matter. Over the last years, great resources have been used to reduce the uncertainty in the estimates of these emissions. A national survey was carried out by Statistics Norway in 2005, in order to obtain information on the replacement of old wood-burning stoves (produced before 1998) and the use of old and new stoves. This enables us to calculate the effect of the replacements of old stoves with new, less polluting ones. The goal is to establish this as an annual survey, thereby ensuring the best possible basis for figures for both local air quality alerts, which are given for all large cities, and for Norway's report on emissions of particulate matter according to the UN Convention on Long-range Transboundary Air Pollution.
Emissions and local air quality
There are important differences between emissions to air and local air quality. The figures presented here cover emissions to air, i.e. the amount of particulate matter that comes out of the chimney or the exhaust pipe. Different emission sources contribute to the concentration of harmful substances in the air. The concentration of the gas/particulate matter is important when determining whether the gas/particulate matter is dangerous to inhale. When calculating the concentrations, one must take into account that the emissions from fuel wood use are emitted from high chimneys, while exhaust from cars and road dust is emitted near the ground. Emissions from the use of fuel wood will be more diluted than road dust before people inhale it. Therefore, a tonne of particulate matter from fuel wood use may have less effect on the ground level concentration than a tonne of exhaust and road dust. |
Tables:
The statistics is published with Emissions to air.
Contact
-
Statistics Norway's Information Centre
E-mail: informasjon@ssb.no
tel.: (+47) 21 09 46 42