Content
Published:
This is an archived release.
Road traffic caused growth in emissions
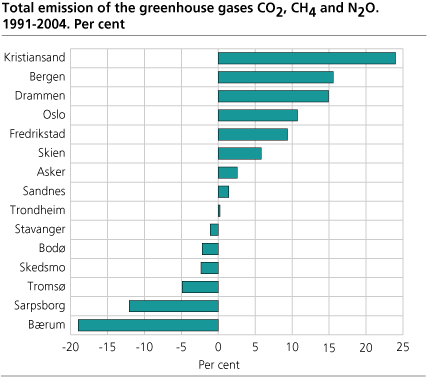
Emissions of greenhouse gases in Norwegian municipalities increased by 12 per cent from 1991 to 2004. Road traffic caused most of the increase, but manufacturing industries, domestic sea transport and air traffic also contributed significantly to the emission growth.
This appears from new figures presented by Statistics Norway in co-operation with the Norwegian Pollution Control Authority.
Increased emissions from road traffic in all municipalities
The calculations show that emissions from road traffic increased in all municipalities in 2004, but in many cases this did not outweigh the decrease in emissions from combustion for heating. Some municipalities also had considerably higher process emissions from the manufacturing industries in 2004. Thus, such municipalities had increased total emissions in 2004, whereas others, without emission intensive industries, had reduced emissions.
The greenhouse gas emissions in the municipalities in 2004 were, on the average, fairly stable, compared with the preceding year. In many municipalities, lower electricity prices in 2004 caused a decrease in emissions from combustion for heating. On the other hand, the emissions in 2003 were considerably higher than in the years before, particularly because of very high electricity prices in the first part of 2003.
Several emission sources dominate
The calculations show that road traffic, manufacturing industries, landfills and agriculture are the most important sources for greenhouse gas emissions in most municipalities. In the large cities, emissions from road traffic and heating usually dominate, whereas emission intensive industrial plants or agriculture may be most important in minor municipalities.
Emissions per capita
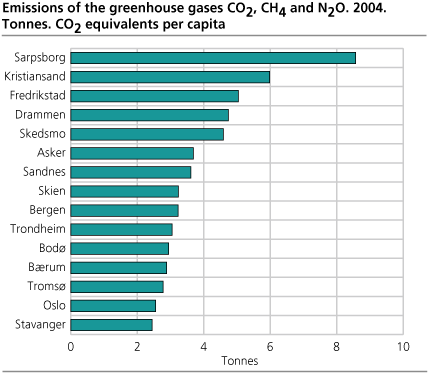
The highest emissions per capita among the 15 most populous Norwegian municipalities, are those with major industrial plants, such as Sarpsborg, Kristiansand and Fredrikstad. The smallest emissions per capita are in Stavanger and Oslo, who have less manufacturing industry, and where road traffic is the most important emission source.
In the period 1991-2004, Bærum had the largest emission decrease (19 per cent) whereas the emissions were reduced by 12 per cent in Sarpsborg. The closing down of Fornebu airport in Bærum and an industrial plant with high process emissions in Sarpsborg explains the major part of these emission reductions.
Extent of the statistics
The statistics cover the greenhouse gases carbon dioxide (CO2), methane (CH4) and nitrous oxide (N2O), which in 2004 contributed to 98.5 per cent of the emissions included in the Kyoto protocol obligations. In addition, there are emissions of HFCs, PFCs and SF6; the two last of these have significance for municipalities with production of aluminium and magnesium. Municipality figures for 1990, which is the base year for the Kyoto protocol, are not available.
This article discusses emissions of greenhouse gases in the municipalities 1991-2004; however also other emission figures, e.g. for particulates, sulphur dioxide (SO2) and nitrogen oxides (NOx), are available, but only for 2003.
Tables
Figures for each municipality can be found in StatBank Norway .
Tables:
The statistics is published with Emissions to air.
Contact
-
Statistics Norway's Information Centre
E-mail: informasjon@ssb.no
tel.: (+47) 21 09 46 42


