Content
Published:
This is an archived release.
Lower greenhouse gas emissions in 2011
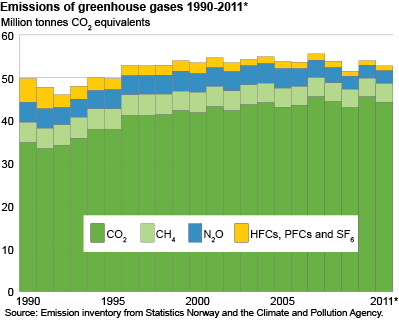
The domestic Norwegian greenhouse gas emissions in 2011 amounted to 52.7 million tonnes of CO 2 equivalents. This is 2.3 per cent less than in 2010. Lower emissions from heating and oil and gas extraction have contributed most to the decline.
These are some of the results found in the new, preliminary emission figures estimated by Statistics Norway in cooperation with the Climate and Pollution Agency.
In 2011, 52.7 million tonnes of CO 2 equivalent greenhouse gases were emitted from Norwegian territory. This is 1.2 million tonnes less than in 2010. Apart from 2009, when the emissions were reduced because of low economic activity, the emissions are the lowest since 1995. The emissions in 2011 were nevertheless 5.8 per cent higher than in 1990. Emissions from Norwegian foreign transport and sinks in forests have not yet been estimated for 2011. Figures for these sources for previous years are discussed here .
| 2011 | Per cent change 1990-2011 | Per cent change 2010-2011 | |||||||||||||||||||||||||||||||||||||||||||||||||||||||||||||||||||||||||||||
|---|---|---|---|---|---|---|---|---|---|---|---|---|---|---|---|---|---|---|---|---|---|---|---|---|---|---|---|---|---|---|---|---|---|---|---|---|---|---|---|---|---|---|---|---|---|---|---|---|---|---|---|---|---|---|---|---|---|---|---|---|---|---|---|---|---|---|---|---|---|---|---|---|---|---|---|---|---|---|---|
| Emissions from Norwegian territory 2 | 52.7 | 5.8 | -2.3 | ||||||||||||||||||||||||||||||||||||||||||||||||||||||||||||||||||||||||||||
| Oil and gas extraction 3 | 13.4 | 73.5 | -2.6 | ||||||||||||||||||||||||||||||||||||||||||||||||||||||||||||||||||||||||||||
| Manufacturing and mining industries | 11.9 | -37.7 | -1.6 | ||||||||||||||||||||||||||||||||||||||||||||||||||||||||||||||||||||||||||||
| Energy supply | 2.1 | 557.8 | -8.6 | ||||||||||||||||||||||||||||||||||||||||||||||||||||||||||||||||||||||||||||
| Heating in other industries and households | 1.4 | -48.7 | -27.5 | ||||||||||||||||||||||||||||||||||||||||||||||||||||||||||||||||||||||||||||
| Road traffic 4 | 10.1 | 29.5 | -0.4 | ||||||||||||||||||||||||||||||||||||||||||||||||||||||||||||||||||||||||||||
| Aviation, coastal traffic, fishing vessels, motor equipment 4 | 7.2 | 27.1 | 0.0 | ||||||||||||||||||||||||||||||||||||||||||||||||||||||||||||||||||||||||||||
| Agriculture | 4.2 | -5.9 | -1.0 | ||||||||||||||||||||||||||||||||||||||||||||||||||||||||||||||||||||||||||||
| Other sources 5 | 2.4 | 13.6 | 5.2 | ||||||||||||||||||||||||||||||||||||||||||||||||||||||||||||||||||||||||||||
| 1 | Does not include international sea and air traffic. |
| 2 | Emissions comprised by the Kyoto protocol. |
| 3 | Including combustion and process emissions from offshore and onshore installations. |
| 4 | Includes transport for hire or reward and on own account in the different industries. |
| 5 | Includes i.a. methane from waste disposal and fluorinated gases. |
| Source: Emission inventory from Statistics Norway and the Climate and Pollution Agency. | |
Lower heating emissions in 2011
Except for February, all months in 2011 were above the average temperature in Norway. For the year as a whole, the temperature was 1.8 degrees C warmer than the average, which made 2011 one of the warmest years registered in Norway. This, combined with low electricity prices, which made it more profitable to use electricity rather than oil for heating purposes, caused a reduction in emissions from heating outside the manufacturing industries by more than a quarter, compared with 2010.
Less from oil and gas extraction
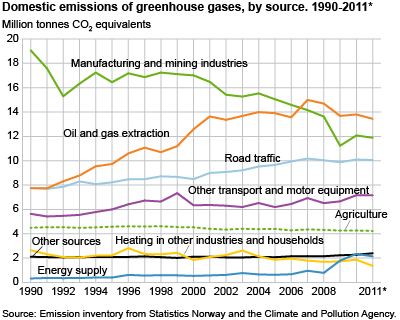
The production of oil and gas was reduced by almost 5 per cent from 2010 to 2011, which contributed to reduced emissions from oil and gas extraction in 2011. Compared with 2010, the emissions were reduced by 2.6 per cent, and amounted to 13.4 million tonnes of CO 2 equivalents in 2011. Since 2007, emissions from oil and gas extraction have been the major source of greenhouse gas emissions in Norway. Increased extraction and higher emissions from plants on shore in the period 1990-2011 resulted in the emissions in 2011 being 73 per cent higher than in 1990. This was nevertheless 10 per cent less than in the peak year 2007. Since 2007, the LNG plant at Melkøya has contributed with large emissions, and these emissions were particularly high in 2007 and 2008. On the other hand, emissions from offshore activities have shown a declining tendency in recent years. In 2011, oil extraction and gas extraction were responsible for 26 per cent of the domestic greenhouse gas emissions, compared to 16 per cent in 1990.
Emissions from manufacturing industries somewhat reduced
The total greenhouse gas emissions from manufacturing industries amounted to 11.9 million tonnes of CO 2 equivalents in 2011, which represents a decrease of 1.6 per cent from the preceding year. Most of the reduction is due to less use of fossil fuels, but lower emissions of nitrous oxide from production of fertilizers also contributed. Since 1990, greenhouse gas emissions from manufacturing industries have been reduced by as much as 38 per cent. The decline in the period 1990-2011 is due to improved technology, less use of oil products and plant closures. From 2010 to 2011, emissions of CO 2 , CH 4 and N 2 O were reduced, while there was a small increase in emissions of PFCs, which at present are the only fluorinated gases emitted by the manufacturing industries in Norway. In 1990, the manufacturing industries were responsible for 38 per cent of the greenhouse gas emissions, which is more than emissions from oil and gas extraction and road traffic combined. The share in 2011 was reduced to 23 per cent, which is less than oil and gas extraction alone.
Small emission decline for road traffic
A decline in fuel sales led to a decrease in calculated emissions from road traffic in 2011, compared with 2010. The greenhouse gas emissions were reduced by 0.4 per cent, and amounted to 10.1 million tonnes of CO 2 equivalents in 2011. Emissions from diesel vehicles grew, but this was more than outweighed by lower emissions from petrol vehicles. Emissions from road traffic have increased by almost 30 per cent since 1990 due to the growing number of vehicles and increased mileage. However, more energy-efficient vehicles, a changeover from petrol to diesel (which causes lower emissions per km) and the addition of bio fuels, have all helped lessen the growth in emissions from road traffic.
Small changes for other transport
Other transport and motorised equipment were responsible for 14 per cent of the greenhouse gas emissions in 2011. Domestic sea transport and fishing are the main contributors here. The emissions in this group grew by 27 per cent from 1990 to 2011, but the share of total emissions has been stable at 11-14 per cent through the whole period.
Stable emissions from agriculture
Greenhouse gas emissions from agriculture were reduced by 1 per cent from 2010 and amounted to 8 per cent of total emissions in 2011. Through the whole period 1990-2011 there have been only small changes in these emissions.
Larger emissions from energy supply in recent years, but decline in 2011
There has been a strong growth in greenhouse gas emissions from energy supply during recent years due to large emissions from the gas power plant at Kårstø and the combined power and heating plant at Mongstad. Emissions from production of district heating have also risen considerably in the period 1990-2011. While emissions from energy supply amounted to only 0.3 million tonnes of CO 2 equivalents in 1990, the corresponding figure for 2011 was 2.1 million tonnes of CO 2 equivalents, or 4 per cent of the total Norwegian greenhouse gas emissions. The emissions were, however, reduced by 9 per cent from 2010 to 2011 because of lower activity at the gas power plant at Kårstø. There will be annual variations in these figures, as the activity is adapted to market conditions.
Other sources
Emissions from landfills and fluorinated gases are the most important sources in the group other sources . The ratio between the emission sources has varied through the period 1990-2011, but as a whole the group’s share of the total emissions has been stable at about 4-5 per cent. From 2010 to 2011 there was a 5 per cent rise, mainly due to increased emissions of fluorinated gases.
International obligations and national targets on emission cutsNorway’s allocated emission quota from the UN amounts to 50.1 million tonnes of CO 2 equivalents annually in the period 2008-2012. This is 1 per cent more than the domestic emissions in 1990. The emissions in 2008-2011 exceeded the allocated annual amount. Norway can, however, fulfil the obligation by using three flexibility mechanisms: Joint Implementation, the Clean Development Mechanism and quota trading.
The emission inventory that is reported annually to the UN also includes emissions and sinks in forests and other land areas. According to the Kyoto Protocol, Norway has an annual entitlement to be credited with approximately 1.5 million tonnes from sinks in forests for the years 2008-2012. Norway’s policy, however, is that these sinks shall not be used to fulfil the Kyoto Protocol obligations.
In 2008, the majority in the Norwegian parliament entered into an agreement on a national target for emission reductions. The target is that domestic emissions shall not exceed 45-47 million tonnes of CO 2 equivalents in 2020. In 2011, the emissions were 5.7-7.7 million tonnes above this national target. |
About the emission inventoryThe figures for 2011 presented in this article are preliminary, but still relatively reliable, particularly regarding the total figures. Detailed tables for 2011, including distributions between source and industry, will be published in the first quarter of 2013, together with preliminary figures for 2012.
See further documentation of the emission accounts . See also emissions to air of nitrogen oxides, sulphur dioxide, ammonia, NMVOC and CO and statistics on emission intensity (these statistics will be updated on 22 May 2012). |
Tables:
- Table 1 Emissions to air, by source. 1990
- Table 2 Emissions to air, by source. 2010
- Table 3 Emissions to air, by source. 2011*
- Table 4 Emissions to air of greenhouse gases. 1980-2011
- Table 5 Emissions to air of greenhouse gases, by industry. 1990, 2010 and 2011*. 1 000 tonnes CO 2 equivalents. Change in per cent
This page has been discontinued, see Emissions to air, Annually.
Contact
-
Trude Melby Bothner
E-mail: trude.melby.bothner@ssb.no
tel.: (+47) 40 81 14 25
-
Berit Storbråten
E-mail: berit.storbraten@ssb.no
tel.: (+47) 40 81 14 23


