Content
Published:
This is an archived release.
Up and down since 1996
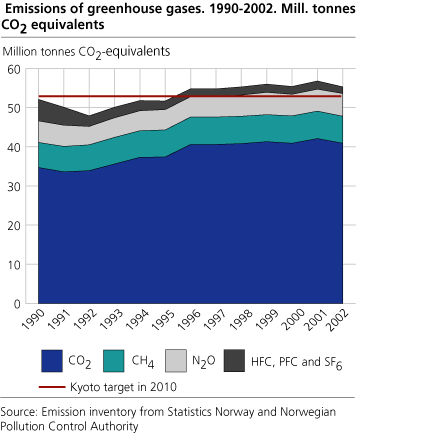
The total Norwegian emissions of greenhouse gases were reduced by 2.5 per cent from 2001 to 2002. However, from 1990, which is the base year in the Kyoto protocol, the emissions have increased by 6 per cent. Since 1996, the emissions have increased less than in the early nineties.
According to the Kyoto protocol, Norwegian greenhouse gas emissions in 2008-2012 should not be more than 1 per cent higher than in 1990. From 1990 to 2002, however, emissions have increased by 6 per cent. Emissions of CO2 have increased most, mainly because of higher production of oil and gas and growth in road traffic.
From 2001 to 2002 the total greenhouse gas emissions were reduced by 2.5 per cent. The publication of preliminary figures for 2003 on April 1.th will show whether or not the decrease has continued.
The reduction from 2001 to 2002 was mainly caused by CO2 and sulphur hexafluoride, but also methane emissions decreased. The decrease in CO2 emissions was due to less activity in the ferro alloy industry, reduced flaring in connection with gas extraction and a general reduction in combustion of energy goods in many manufacturing industries.
Emissions of SF6 were reduced by two thirds because of closing down of the production of magnesium. There were reductions in methane emissions both from loading of oil on the continental shelf and from landfills and agriculture. At the same time, nitrous oxide emissions increased by 5 per cent. Emissions of perfluorocarbons (PFCs) and hydrofluorocarbons (HFCs) increased; the latter are increasing continually, as they replace gases that are harmful to the ozone layer.
Emissions of nitrous oxide (N2O) and CO2 from road traffic continued to increase in 2002, due to more use of diesel cars and the fact that cars with catalytic converters emit more N2O than those without. The increase in emissions from road traffic constitutes 0.5 per cent of Norway's total greenhouse gas emissions.
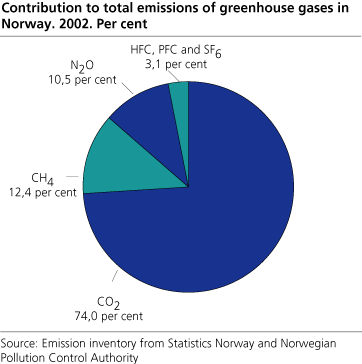
Of the total greenhouse gas emissions in 2002, reckoned in CO2 equivalents, 74 per cent came from CO2, 12 per cent from methane, 11 per cent from nitrous oxide and 3 per cent from HFCs, PFCs and SF6.
In 2002, 43 per cent of the CO2 emissions came from stationary combustion, nearly half of this from combustion of natural gas for electricity production on the continental shelf; 23 per cent came from road traffic and 16 per cent from processes in the manufacturing industries. The remainder is mostly due to other process emissions and air and sea traffic.
Emissions of heavy metals and persistent organic pollutants and long-range air pollution are treated in separate articles (see below). Preliminary figures for 2003 will be presented on April 1st. Emission figures for municipalities for greenhouse gases 1991, 1995, 2000 and 2001 and for other gases 2001 will be presented the 1st of March.
Read more:
State of the Environment Norway
Other articles on emission to air:
Sulphur emissions reduced since 1990 (SSB 13.02.2004)
Emission of heavy metals down (SSB 13.02.2004)
Tables in the StatBank .
Tables:
Contact
-
Trude Melby Bothner
E-mail: trude.melby.bothner@ssb.no
tel.: (+47) 40 81 14 25
-
Berit Storbråten
E-mail: berit.storbraten@ssb.no
tel.: (+47) 40 81 14 23


