Content
Published:
This is an archived release.
Strong rise in greenhouse gas emissions
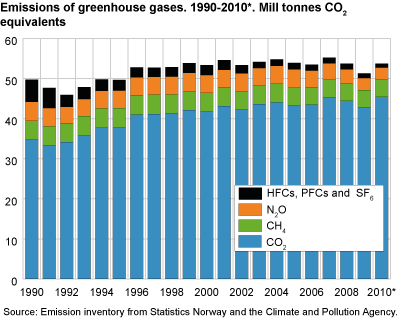
The two-year decrease in Norwegian greenhouse gas emissions was followed by a new increase in 2010, when the emissions amounted to 53.7 million tonnes CO2 equivalents. This is 4.8 per cent more than in 2009. Higher metal production and more transport have contributed most to the increase.
These are some of the results found in the new, preliminary emission figures estimated by Statistics Norway in cooperation with the Climate and Pollution Agency.
The total Norwegian greenhouse gas emissions were 2.5 million tonnes higher in 2010 than in 2009. The large increase should be regarded in relation to the emission reductions in 2008 and 2009, caused by the financial crisis. Increased economic activity in 2010 contributed to higher emissions from manufacturing industries and transport. In addition, a cold winter with high electricity prices led to an increase in emissions from heating. There were only minor changes from 2009 to 2010 in emissions from agriculture and oil and gas-related activities.
| 2010 | Per cent change 1990-2010 | Per cent change 2009-2010 | |||||||||||||||||||||||||||||||||||||||||||||||||||||||||||||||||||||||||||||
|---|---|---|---|---|---|---|---|---|---|---|---|---|---|---|---|---|---|---|---|---|---|---|---|---|---|---|---|---|---|---|---|---|---|---|---|---|---|---|---|---|---|---|---|---|---|---|---|---|---|---|---|---|---|---|---|---|---|---|---|---|---|---|---|---|---|---|---|---|---|---|---|---|---|---|---|---|---|---|---|
| Total | 53.7 | 8.0 | 4.8 | ||||||||||||||||||||||||||||||||||||||||||||||||||||||||||||||||||||||||||||
| Oil and gas extraction1 | 13.8 | 77.7 | 0.8 | ||||||||||||||||||||||||||||||||||||||||||||||||||||||||||||||||||||||||||||
| Manufacturing and mining industries | 11.9 | -37.4 | 5.4 | ||||||||||||||||||||||||||||||||||||||||||||||||||||||||||||||||||||||||||||
| Energy supply | 2.1 | 549.4 | 17.4 | ||||||||||||||||||||||||||||||||||||||||||||||||||||||||||||||||||||||||||||
| Road traffic | 10.1 | 30.3 | 3.5 | ||||||||||||||||||||||||||||||||||||||||||||||||||||||||||||||||||||||||||||
| Other transport and motor equipment | 7.3 | 29.0 | 9.8 | ||||||||||||||||||||||||||||||||||||||||||||||||||||||||||||||||||||||||||||
| Agriculture | 4.2 | -5.9 | 0.0 | ||||||||||||||||||||||||||||||||||||||||||||||||||||||||||||||||||||||||||||
| Other emissions | 4.4 | -8.4 | 10.8 | ||||||||||||||||||||||||||||||||||||||||||||||||||||||||||||||||||||||||||||
| 1 | Includes stationary combustion offshore and in onshore installations (mainly gas terminals). |
| Source: Emission inventory from Statistics Norway and the Climate and Pollution Agency. | |
Large increase in emissions from metal production
The total greenhouse gas emissions from manufacturing industries and mining rose by somewhat more than 0.6 million tonnes (5.4 per cent) from 2009 to 2010. However, the emissions were 7 million tonnes lower than in 1990. The emissions from these industries have had a decreasing trend during the last 20 years. In 2008 and 2009, however, there was a strong emission decline, primarily due to the financial crisis, which also led to reduced demand for goods.
Since autumn 2009, there has been a growth in demand both at home and abroad, which has brought about higher production in many manufacturing industries. This has caused higher greenhouse gas emissions, particularly from production of ferroalloys. This production is the source of CO2 emissions when carboniferous products, such as coal and coke, are used as reducing agents.
Renewed growth in transport emissions
Greenhouse gas emissions from road traffic increased by 0.3 million tonnes (3.5 per cent) in 2010, amounting to 10.1 million tonnes. These emissions were somewhat more than 30 per cent higher in 2010 than in 1990, but went through a temporary decline in 2008 and 2009. In particular, the transport of goods was affected by the agitated financial market. According to Statistics Norway’s survey on lorry transport, the transport labour (includes both amount transported and distance covered) was reduced from the fourth quarter of 2008 to the second quarter of 2009. In total, the transport labour for vans was somewhat more than 7 per cent higher in 2010 than in the preceding year. The rise in greenhouse gas emissions from all road traffic caused almost a return to the level before 2008. More energy efficient vehicles, a changeover from petrol to auto diesel and intermixture of bio fuels may have helped to diminish the emission growth somewhat.
Emissions from other transport, such as air and sea transport and motorised equipment (construction machines, tractors etc.) also increased strongly in 2010. For the time being, these emissions are burdened with much uncertainty.
New power plan contributed to higher emissions
In 2009, greenhouse gas emissions from energy supply increased strongly due to high activity at the Kårstø gas power plant. In 2010, the start-up of the new power plant at Mongstad caused a further emission increase. This plant mainly delivers electricity and heat to the Mongstad refinery. The commissioning of gas power and district heating plants has resulted in emissions from energy supply being six times higher in 2010 than in 1990.
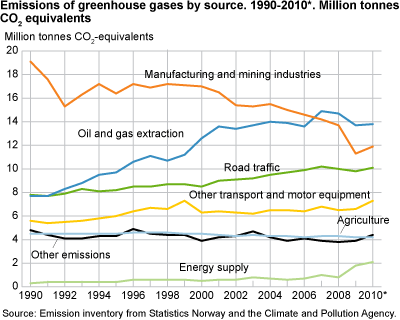
High heating emissions in 2010
Low temperatures and high electricity prices led to more use of heating oils and kerosene in 2010, which also caused higher emissions from heating than in the preceding year. Electricity is continually being used more for heating purposes. In 2009, heating oil contributed to 4 per cent of the total energy use in households, compared to almost 8 per cent in 1993 (see Statistics Norway’s survey on energy consumption in households ).
Peak figures for CO2, less nitrous oxides
While total greenhouse gas emissions have increased by 8 per cent from 1990, emissions of CO2 have grown by more than 30 per cent. The strong growth in oil and gas production in the 1990s is the main cause of the emission increase. In 2010, the emissions of this gas grew by 2.6 million tonnes, amounting to 45.4 million tonnes. This is the highest emission figure in the period where emissions have been calculated, i.e. from 1973.
The emissions of methane, nitrous oxide and fluorinated gases showed only minor changes from 2009 to 2010. Emissions of nitrous oxide from the manufacturing industries have been reduced several years running due to the introduction of environmental technology in the production of fertilisers. A change in technology also contributed to lower emissions of nitrous oxide in 2010, although there was a large production increase.
National targets on emission reduction and international commitmentsThe UN has given Norway an emission quota corresponding to 50.1 million tonnes CO2 equivalents annually in the period 2008-2012. This is 1 per cent above the Norwegian emission level in 1990. The emissions for the years 2008-2010 surpass the assigned amount, but a fulfilment of the commitment is still within reach due to Norway’s participation in the EU’s quota system (EU ETS). The emission accounts that are reported annually to the UN also include emissions and uptake in forests. According to calculations performed by the Norwegian Forest and Landscape Institute, net uptake in Norwegian forests in 2009 amounted to 25 million tonnes CO2. This is about half of the annual greenhouse gas emissions measured in CO2 equivalents. According to the Kyoto Protocol, Norway may annually be credited approximately 1.5 million tonnes from uptake in forests in the period 2008-2012. In 2008, the majority in the Norwegian national assembly entered into an agreement on national targets for emission reductions. The aim is that domestic emissions shall not surpass 45-47 million tonnes CO2 equivalents in 2020. In 2010, the emissions were 6.7-8.7 million tonnes above this national target. |
About the emission inventoryThe figures for 2010 presented in this article are preliminary, but still relatively reliable, particularly regarding the total figures. Detailed tables for 2010, including distributions between source and industry, will not be published until February 2012. See further documentation of the emission accounts . See also emissions to air of nitrogen oxides, sulphur dioxide, ammonia, NMVOC and CO and statistics on emission intensity. |
Tables:
This page has been discontinued, see Emissions to air, Annually.
Contact
-
Trude Melby Bothner
E-mail: trude.melby.bothner@ssb.no
tel.: (+47) 40 81 14 25
-
Berit Storbråten
E-mail: berit.storbraten@ssb.no
tel.: (+47) 40 81 14 23