Content
Published:
This is an archived release.
Temporary reduction in emissions of greenhouse gases
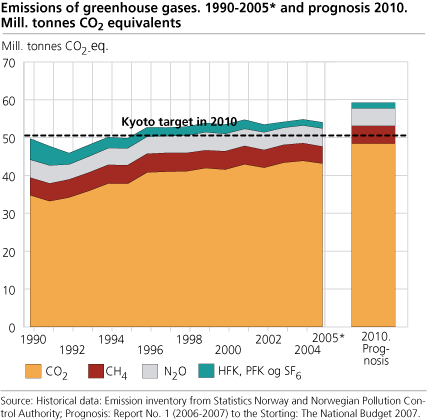
Emissions of greenhouse gases increased by 8.5 per cent between 1990 and 2005. In 2005, total emissions of greenhouse gases were reduced compared with the previous year, however, there is no reason to believe that this is the beginning of a new trend. Instead, the greenhouse gas emissions are expected to rise again when the plants at Kårstø and Melkøya start up.
This is shown in calculations from Statistics Norway and the Norwegian Pollution Control Authority.
In 2005, the Norwegian greenhouse gas emissions totalled 54 million tonnes CO2 equivalents. This represents a growth of 8.5 per cent since 1990. Most of this increase occurred prior to 1999, whereas subsequent emissions have been relatively stable. In 2005, the emissions were only 0.3 per cent higher than in 1999. However, the emissions are expected to increase again after 2005 (see below).
Three sources accounted for three quarters of emissions
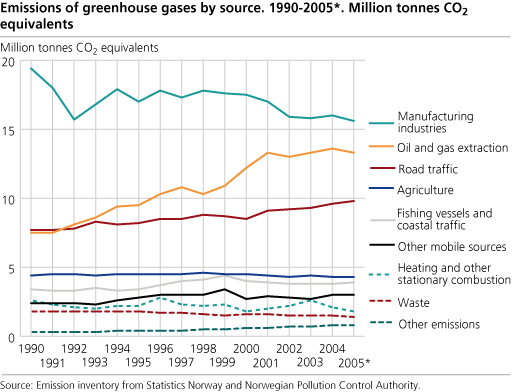
Of the total emissions of greenhouse gases in 2005, the manufacturing industry, oil and gas activities and road traffic were responsible for 29, 25 and 18 per cent respectively, or 72 per cent in total. Still, there are other substantial sources; agriculture was responsible for 8 per cent of the emissions, 7 per cent could be attributed to domestic shipping and fishing, whereas air traffic and other mobile sources accounted for slightly more than 5 per cent. Other sources such as landfills and heating of dwellings accounted for close to 8 per cent of the total emissions of greenhouse gases.
Manufacturing industry important, but emissions decrease
As mentioned above, the manufacturing industry is the most important source of emissions, accounting for 29 per cent of the greenhouse gas emissions in 2005. Contrary to the other major sources, the manufacturing industry has reduced its emissions considerably since 1990. The emissions have decreased by 20 per cent, or almost 4 million tonnes CO2 equivalents, which corresponds to emissions from more than three gas-fired power plants without CO2 handling, like the one being built at Kårstø. The overall reduction has occurred despite isolated increases in emissions due to production growth among several important manufacturers. The reason for the general decline is a reduction in emissions of perfluorocarbons (PFCs) and SF6, which are important in the production of aluminium and magnesium. These emissions have been cut substantially due to specific measures such as technology improvements and improved process control, but also owing to the closing down of a plant responsible for large emissions of SF6.
Oil and gas activities and road traffic accounted for nearly half
As mentioned above, oil and gas activities were responsible for about 25 per cent of the emissions in 2005. As opposed to the manufacturing industry, greenhouse gas emissions from oil and gas activities have increased considerably since 1990. The emissions from oil and gas activities have increased by 78 per cent, whereas the total oil and gas production has risen by 205 per cent from 1990 to 2005. While gas production increases steadily, oil production has declined in recent years. Oil production reached a peak in 2001, when output was 98 per cent higher than in 1990.
The emissions from road traffic, which made up 18 per cent of the total in 2005, have risen by 27 per cent in the period 1990-2005. The increase was especially large for emissions from freight transport, amounting to a growth of 50 per cent. This growth is explained by both a general boost in economic activities and increased consumption. The emissions from passenger cars have increased by 7 per cent, whereas the number of kilometres covered has risen by approximately 25 per cent. This means that there has been an increase in energy efficiency of the passenger car fleet. Both petrol-powered and diesel-powered vehicles have become more energy efficient. The transition to more diesel-powered vehicles has been of less importance for emission figures. In 2005, only 12 per cent of the passenger cars were diesel-powered, but these are used more and accounted for 15 per cent of total kilometre coverage.
Down by 1.4 per cent in 2005
From 2004 to 2005, total emissions of greenhouse gases fell by 1.4 per cent. There were two main reasons for this reduction: less use of oil for heating, probably induced by higher prices of oil, and reduced emissions from some emission intensive industries, due to production decline. The consumption of oil for heating by households and parts of the industry varies with i.a. changes in prices of oil and electricity, as well as temperature, resulting in variations from year to year in appurtenant emissions.
but probably not a new trend
Even though the total emissions of greenhouse gases were somewhat reduced in 2005, there is no reason to believe that this is the beginning of a downward trend. Instead, the Norwegian greenhouse gas emissions are expected to increase considerably over the next years, due to start-up of the plants at Kårstø and Melkøya. At present, no means or measures have been passed or implemented that will counteract this emission increase related to energy production in the short term.
The production index shows that production has grown in many manufacturing industries in 2006, compared with the previous year. For example, the metal industry, which is the source of substantial emissions, increased production by 1.7 per cent compared with 2005, according to weekly-corrected figures. After a decline in 2005, sales of petroleum products rose again in 2006 by nearly 4 per cent. As mentioned previously, part of this consumption is very sensitive to fluctuations in the price relation between oil and electricity. Sales of dutiable diesel oil increased by around 10 per cent compared with sales in 2005. However, the total production of oil and gas has fallen slightly in 2006, compared with the previous year. Thus, a rise in related emissions is not expected for 2006.
On 11 May 2007, preliminary figures for greenhouse gas emissions in 2006 will be published.
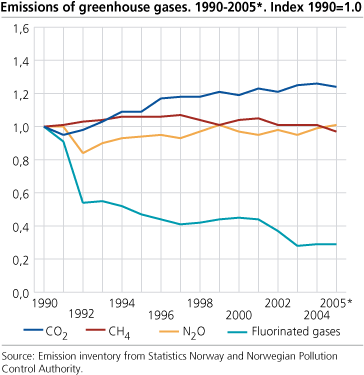
Greenhouse gases include the six gases comprised by the Kyoto Protocol (see box): carbon dioxide (CO2), methane (CH4), nitrous oxide (N2O) hydrofluorocarbons (HFCs), perfluorocarbons (PFCs) and sulphur hexafluoride (SF6). In 2005, CO2 made up almost 80 per cent of the greenhouse gas emissions by tonnes CO2 equivalents, whereas methane and nitrous oxide constituted 17 per cent. The fluorinated gases amounted to 3 per cent of the total emissions in 2005.
Since 1990, CO2 emissions have increased by 24 per cent, whereas emissions of fluorinated gases have been reduced by 71 per cent.
|
About the Kyoto Protocol and Norway's commitment
So far, 168 countries have ratified the Kyoto Protocol (13 December 2006). Of these, Norway is one among 36 industrialised countries that will have a national quota (assigned amount) for the period 2008-2012. If their emissions exceed their quotas, they must make use of the Kyoto mechanisms, which make it possible to buy emission quotas from other countries with national quotas, or finance projects for reduction of emissions in developing countries (CDM - Clean Development Mechanism). Norway's assigned amount will probably be about 251 million tonnes CO2 equivalents (1 per cent more than the emissions in 1990 for every year in the period 2008-2012). In 2005, the total Norwegian emissions of greenhouse gases amounted to 54.0 million tonnes CO2 equivalents. Projections made by the Norwegian Government indicate that the emissions will add up to 59.2 million tonnes in 2010. If the emissions stabilise at this level through the whole of the Kyoto period, Norway will have to buy emission quotas in the range of 45 million tonnes for the period 2008-2012 as a whole. The projection for 2010 does not include overall emissions of up to 2 million tonnes CO2 from the power plants at Kårstø and Mongstad. The CO2 handling at the two power plants are at present not expected to be up and running until 2011/12 and 2014 respectively. During spring 2007, the Government will propose sector specific climate action plans that will set emission targets for each sector of society for the period 2008-2012, as well as propose specific means for reaching these goals. The Government has also announced that it will present a national target for greenhouse gas emissions in 2020 by the end of 2007. |
|
Recalculation of emission figures
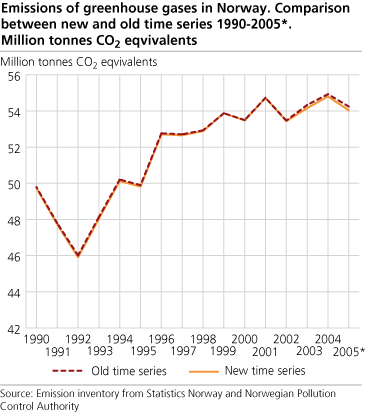
The Climate Convention and the Kyoto Protocol impose on the industrialised countries a strict regime for calculation and reporting on emissions of CO2 and other greenhouse gases, and countries are asked to continuously develop the calculation methodology. The Norwegian emission inventory is every year recalculated for the entire time series for all components, to account for new knowledge on activity data and emission factors and to correct discovered errors in the calculations. When the Kyoto period starts, it will be of increased significance that such recalculations are made and that the countries perform them independently of whether they will result in higher or lower emission figures. In the latest calculations, the total emissions of greenhouse gases during 1990-2005 are 0.1 per cent lower per year than in the previous inventory. In practice, this implies only marginal changes relating to the fulfilment of the commitment under the Kyoto Protocol. The most important change concerns methane emissions from landfills, which is now 7-10 per cent lower for the whole period than previously calculated. The CH4 emissions from combustion at oil refineries are also somewhat lower than in the previous inventory. In addition, the emissions from coastal traffic in 2003 and 2004 are reduced, due to revised figures on fuel consumption. These reductions are somewhat counteracted by the inclusion of some emissions from wood processing industries and oil refineries that have not been calculated before. Furthermore, some minor upward or downward adjustments have been made for all gases. |
Other article published today
21 per cent cut in NOX emissions required by 2010
Reduced emissions of hazardous substances
Documentation
More figures in StatBank
Tables:
This page has been discontinued, see Emissions to air, Annually.
Contact
-
Trude Melby Bothner
E-mail: trude.melby.bothner@ssb.no
tel.: (+47) 40 81 14 25
-
Berit Storbråten
E-mail: berit.storbraten@ssb.no
tel.: (+47) 40 81 14 23


