Content
Published:
This is an archived release.
30 700 tonnes of organic material from wastewater
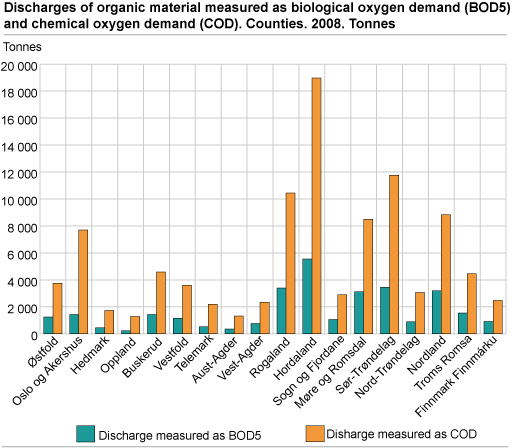
Estimates of discharges from the wastewater sector show that 30 700 tonnes of organic material, measured as biological oxygen demand (BOD5), were discharged through the wastewater systems in 2008. In comparison, measured as chemical oxygen demand (COD), the discharge was 99 900 tonnes.
The official wastewater statistics have been expanded with statistics on total discharges of organic material, measured as biological oxygen demand (BOD5) and chemical oxygen demand (COD). BOD5 includes organic material that is easily and biologically decomposable, while COD also includes substances of organic material that are harder to break down (“chemical decomposition”). Thus, the level of COD will for that reason normally be higher than BOD5.
The sources of these discharges come from greywater in households (mainly from kitchens, bathrooms and washrooms) and blackwater (sewage), and the part of the industry and service sector that is connected to the municipal wastewater pipeline system.
Organic material discharged from wastewater to the recipient is broken down by micro organisms, applying in particular to the easily decomposable part of it. This process, however, requires oxygen, and in large supplies organic material may lead to oxygen deprived water, with fish being killed and poor water quality as possible results.
Increase in discharges of phosphorous and nitrogen
For 2008, the discharges of phosphorous (tot-P) and nitrogen (tot-N) from municipal wastewater sector have been estimated at 800 tonnes and 12 700 tonnes respectively; an increase of 1 and 2 per cent respectively compared to the previous year. These discharges correspond to 0.20 kg per inhabitant connected for phosphorous and 3.23 kg for nitrogen.
The treatment efficiencies for the wastewater sector as a whole have been estimated at 70 per cent for phosphorous and 32 per cent for nitrogen. This constitutes an increase of 1 per cent for both phosphorous and nitrogen compared to 2007.
Heavy metals in wastewater and sewage sludge
The statistics provide the opportunity to compare the amount of heavy metals discharged from wastewater with the amount that ended up in the sewage sludge. The statistics then show that the heavy metals released to the water recipient together with the treated wastewater and the amounts found in sewage sludge tend to be at around the same amounts (with nickel as the one possible exception).
|
Total amount of heavy metals in sewage
sludge and treated wastewater |
Amount in treated wastewater | Amount in sewage sludge1 | |||||||||||||||||||||||||||||||||||||
|---|---|---|---|---|---|---|---|---|---|---|---|---|---|---|---|---|---|---|---|---|---|---|---|---|---|---|---|---|---|---|---|---|---|---|---|---|---|---|---|
| Kilogrammes | |||||||||||||||||||||||||||||||||||||||
| Arsenic (As) | . | 580 | . | ||||||||||||||||||||||||||||||||||||
| Cadmium (Cd) | 118 | 60 | 58 | ||||||||||||||||||||||||||||||||||||
| Chromium (Cr) | 4 162 | 2 000 | 2 162 | ||||||||||||||||||||||||||||||||||||
| Copper (Cu) | 31 279 | 12 000 | 19 279 | ||||||||||||||||||||||||||||||||||||
| Mercury (Hg) | 91 | 40 | 51 | ||||||||||||||||||||||||||||||||||||
| Nickel (Ni) | 5 392 | 4 000 | 1 392 | ||||||||||||||||||||||||||||||||||||
| Lead (Pb) | 2 885 | 1 200 | 1 685 | ||||||||||||||||||||||||||||||||||||
| Zinc (Zn) | 69 358 | 37 000 | 32 358 | ||||||||||||||||||||||||||||||||||||
| 1 | Estimation based on average content of heavy metals in sewage sludge and treated wastewater. |
2 per cent increase in total capacity
In 2008, the municipal wastewater facilities had a total capacity of around 6.4 million person equivalents (pe). This constitutes an increase of 0.1 million compared to the year before, and the reason is mainly an increase in chemical and/or biological treatment.
The total capacity can be broken down into 6.0 million pe from wastewater treatment plants (treatment capacity), and 0.4 million pe originating from direct discharges (untreated wastewater).
58 per cent of the population connected to high-grade treatment
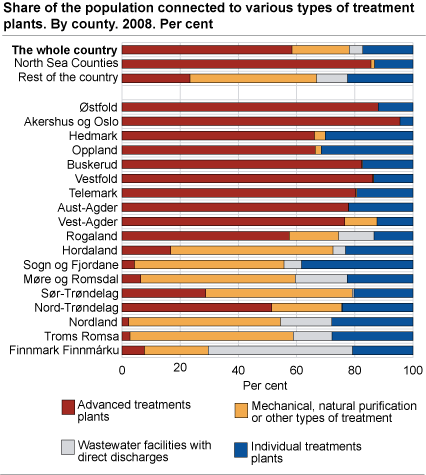
In 2008, 58 per cent of Norway’s population was connected to high-grade treatment plants - biological and/or chemical treatment. This is an increase of 1 per cent compared to last year. Furthermore, 20 per cent was connected to mechanical or other types of treatment, 5 per cent had direct discharges and the remaining 17 per cent of the population were connected to small wastewater facilities (less than 50 pe).
Estimates for 2008 show that a total of 2 766 municipal wastewater facilities (capacity 50 pe or more) were in operation for the whole or part of the year. These wastewater facilities treat wastewater for approximately 83 per cent of the population, which is around the same level as last year.
The general picture is a relatively high level of high-grade treatment among relatively large wastewater facilities, while mechanical treatment is more common among smaller wastewater facilities. For example, among wastewater facilities larger than 50 000 pe, high-grade constituted around 86 per cent of the facilities. In comparison, only 15 per cent was high-grade among facilities with capacity between 50-99 pe.
58 per cent of sewage sludge to agriculture
A total of 101 400 tonnes of dry weight sewage sludge was used in 2008, of which 58 per cent was used as soil improvement in agriculture and 15 per cent was used in parks and green spaces.
Increased costs of wastewater services
Wastewater fees are determined by the municipalities in accordance with the full cost principle. Local conditions such as patterns of built-up area, topography (terrain), bedrocks in the ground, the need for pumping stations and treatment requirements are factors behind the variation in fees.
In 2008, the total cost for all municipalities was NOK 5.23 billion. This constitutes an increase of 7 per cent compared to the year before. The costs related to the wastewater sector are made up of capital costs and operating costs. The figures for the entire country are calculated based on the data reported in KOSTRA, with estimates for data missing. The estimates are based on data reported last year and average figures from the groups of municipalities in KOSTRA.
The income from fees does not cover all the costs
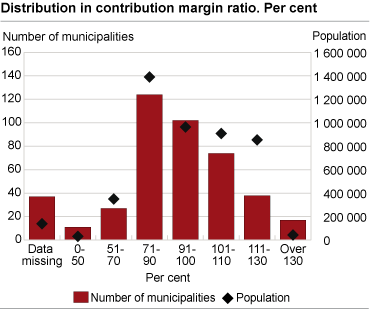
A total of 58 per cent of the population live in municipalities with a contribution margin ratio less than 100 per cent, which means that the incomes from fees are below the fee calculation basis.
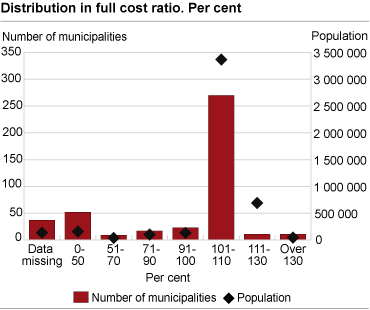
A total of 63 per cent of the municipalities have a full cost ratio between 98 and 102 per cent, and these municipalities are home to 72 per cent of the population. A major part of the population lives in municipalities where the costs for wastewater services are covered by fees.
The full cost ratio reflects the relationship between the income from fees and the fee calculation basis, and includes fund provisions and purchases from funds.
For more wastewater statistics - see this year's report (in Norwegian only - English abstract).
Tables:
Contact
-
Gisle Berge
E-mail: gisle.berge@ssb.no
tel.: (+47) 48 12 19 97


