Content
Published:
This is an archived release.
More sewage sludge to agriculture
New calculations show that more sewage sludge than previously anticipated is discharged to agricultural land. In 2005, around 53 000 tonnes of sludge was used as fertilizer and soil improvement in agriculture, which is around half the total amount. The discharge of phosphorous and nitrogen from municipal wastewater systems have been estimated to 700 tonnes and nearly 12 000 tonnes respectively.
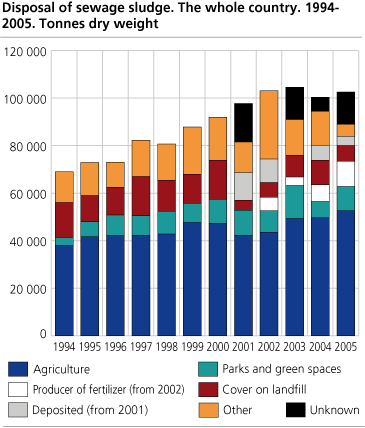
The figures for 2005 show that 103 000 tonnes dry weight sewage sludge was used this year, whereof 14 000 tonnes were categorised as “unknown use”. 53 000 tonnes dry weight was used as fertilizer and soil improvement in agriculture.
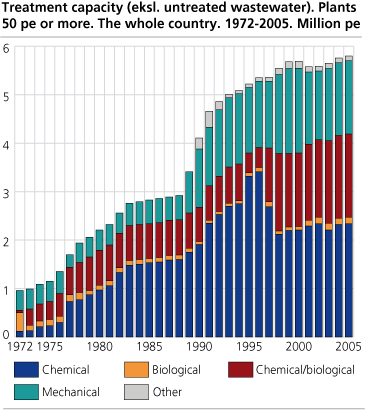
Total capacity in the municipal wastewater sector was around 6.2 million person equivalents (pe) in 2005, of which 5.80 million pe is subject to some kind of treatment (also called treatment capacity) and 0.4 million pe is left untreated.
|
New calculation of the statistics on capacity and sewage sludge
It has been carried out a re-calculation on capacity of municipal wastewater facilities for 1998-2004 and sewage sludge for the years 1994-2004. Consequently, the statistics have been adjusted for the years mentioned. The main reason for the adjustment is mainly due to shortcomings in the reported data and a need for better connect data from three different reporting systems, namely SSB-avløp (1993-1997), SESAM (1998-2001) and KOSTRA (2002-2005). For sewage sludge, the statistics has partly been revised with the background in independent research carried out by NORVAR. The article published last year can be accessed here. As for sewage sludge, the re-calculation has lead to a lower total amount of sludge in 2004. In the same year, sludge to agriculture has increased from the previous 42 000 tonnes before re-calculations to around 50 000 tonnes after, thus a large increase compared to previously anticipated. In addition the re-calculation has also lead to a relatively large reduction of sludge to agriculture in 1998-2000. The most important changes in the re-calculation of capacity is that the total capacity levels now show a less abrupt deviation during transition between the two reporting systems, SESAM and KOSTRA around 2001/02. |
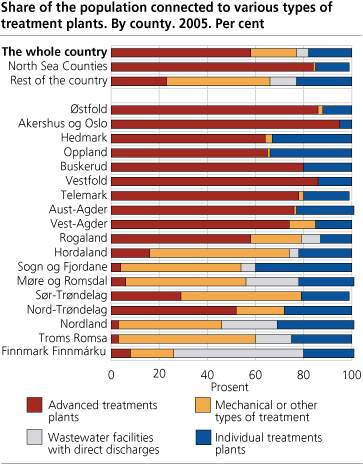
Regional differences in treatment
For 2005 the discharges of phosphorous (tot-P) and nitrogen (tot-N) from municipal wastewater systems have been estimated to be 727 tonnes and 11 879 tonnes respectively. In 2004, the corresponding figures were 707 tonnes and 11 613 tonnes.
For the North Sea counties (from Østfold to Vest-Agder) discharges originating from the municipal wastewater sector have been estimated to be 117 tonnes of phosphorous, equivalent to 0.05 kilogram per inhabitant connected to a treatment plant. In 2004, the discharge was 108 tonnes. The corresponding figure for the rest of the country was 609 tonnes of phosphorous, equivalent to 0.40 kilogram per inhabitant connected to a treatment plant.
Furthermore, the North Sea counties discharged another 6 105 tonnes of nitrogen, equivalent to 2.73 kilogram per inhabitant connected to a treatment plant. In 2004, the same counties contributed with 5 863 tonnes to the North Sea. In comparison, the other counties discharged 5 774 tonnes of nitrogen, equivalent to 3.77 kilogram per inhabitant connected to a treatment plant.
The North Sea Area is important as this area is subject to international obligations, including the North Sea declaration and OSPAR-convention.
57 per cent covered by high-grade treatment
The proportion of Norway’s population connected to high-grade treatment plants, here defined as biological and/or chemical treatment, was 57 per cent on average in 2005. This constitutes a 1 per cent increase compared to last year. In the North Sea counties, around 86 per cent of the population was connected to high-grade treatment plants. As for the remaining counties, the 22 per cent without drainage into the North Sea were connected to high-grade treatment plants.
Estimates show that for 2005 a total of 2 665 municipal wastewater facilities (capacity of 50 pe or more) were in operation at least in part of the year. These facilities accommodate wastewater from around 80 per cent of the population. The municipal wastewater facilities may further be subdivided into 2 158 treatment plants and 507 direct discharges (no treatment), with 75 and 5 per cent coverage of the population, respectively. The remaining 20 per cent are connected to small wastewater facilities with a capacity less than 50 pe (mainly individual plants).
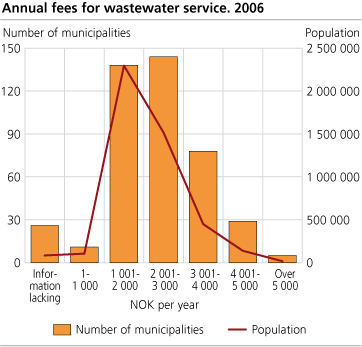
Higher annual fees in less populated municipalities
The annual fee was NOK 2 095 on average in 2006 (VAT excluded, weighted average). Compared with 2005, this is a 1 per cent reduction. Sparsely populated municipalities have higher annual fees than densely populated municipalities.
Municipal wastewater fees are in accordance with full cost regulations set by the municipal authorities. Full cost involves that the cost of the service should be reflected in the fee level, and above all not exceed the municipal cost of the service with revenues collected by fees. The fee level generally varies due to differences in type of settlement patterns and geographical characteristics.
Some users pay per volume wastewater discharged, and this fee was NOK 10.70 per cubic metre on average in 2006 (VAT excluded). In 2005 this was NOK 10.50.
The connection fee is a one-time payment by the user at the time of connecting to the existing wastewater pipeline system. In 2006, the connection fee was NOK 13 012 on average (VAT excluded, and weighted average), an increase of around 6 per cent compared to the year before.
The new report on waste water is available here.
For more information about the economy in the municipal wastewater sector, please refer to the report Analysis of physical data from the wastewater treatment sector 2003 (report 2005/06) .
For further information, contact:
Contact
-
Gisle Berge
E-mail: gisle.berge@ssb.no
tel.: (+47) 48 12 19 97