Content
Published:
This is an archived release.
Increasing nitrogen removal
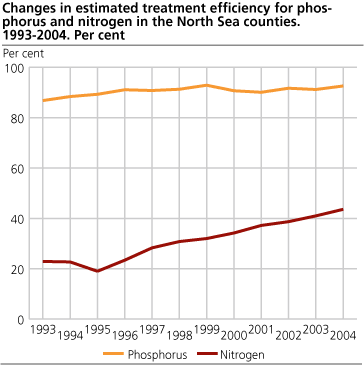
Municipal wastewater treatment plants surrounding the North Sea are increasingly removing nitrogen from their wastewater - 44 per cent was removed in 2004. The corresponding figure was 23 per cent in 1993. The portion of the population connected to high-grade treatment plants is also rising.
The 2004 statistics reveals that the trend in the 1990s, with increasing nitrogen removal, and a relatively stable high removal of phosphorus of the wastewater to the North Sea is continuing. In the rest of the country the removal of phosphorus and nitrogen nutrients are somewhat variable, and often depending on local conditions.
Regional differences
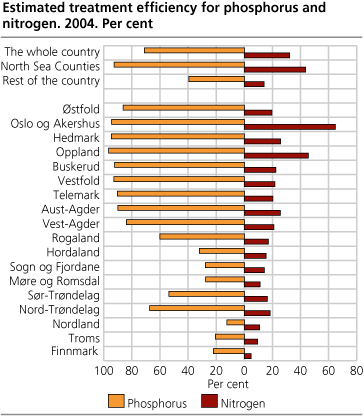
For 2004, the discharges of phosphorous and nitrogen from municipal wastewater systems have been estimated to 708 tonnes and 11 494 tonnes respectively. As for the North Sea counties (from Østfold to Vest-Agder), the discharges originating from municipal wastewater sector have been estimated to be 108 tonnes of phosphorous, equivalent to 0.05 kilogram per inhabitant connected. The corresponding figure for the rest of the country was 599 tonnes of phosphorous, equivalent with 0,41 kilogram per inhabitant connected.
The North Sea counties discharged another 5 863 tonnes of nitrogen, equivalent to 2.70 kilogram per inhabitant connected. For comparison, the corresponding figure for the rest of the country is 5 631 tonnes, equivalent to 3.84 kilogram per inhabitant connected. The per inhabitant discharge for Oslo and Akershus, primarily draining to the Inner Oslofjord, is relatively low compared to all the other counties, resulting in a combined discharge for the two counties of 1.73 kilogram per inhabitant connected. The evident difference between the North Sea counties and the rest of the country, but also the special conditions with the Oslo and Akershus region, is primarily a result of international obligations in regards to nutrient removal (the North Sea declaration and OSPAR-convention). In the follow-up of these agreements, a few large wastewater treatment plants have installed specialised nitrogen removal techniques, mainly in the Oslo/Akershus region.
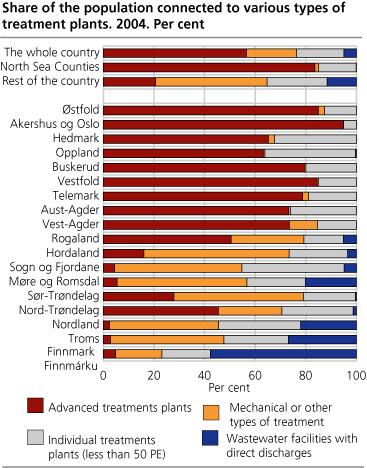
The portion of Norway’s population connected to high-grade treatment plants, here defined as biological and/or chemical treatment, was on the average around 56 per cent in 2004. This constitutes a 1 per cent increase compared to last year. In the North Sea counties, around 85 per cent of the population was connected to high-grade treatment plants. As for the remaining counties, those without drainage into the North Sea, about 20 per cent were connected to high-grade treatment plants.
It’s been estimated that for 2004 that a total of 2 597 municipal wastewater facilities (hydraulic capacity of 50 PE or more) were in operation at least in part of the year. These facilities accommodate wastewater from around 80 per cent of the country population. The municipal wastewater facilities may further be subdivided into 2 068 treatment plants and 529 direct discharges (no treatment), with 75 and 5 per cent coverage of the population respectively. The remaining 20 per cent are connected to small wastewater facilities with a hydraulic capacity of less than 50 pe (mainly individual plants).
Counties like Hordaland, Hedmark and Nordland with highly scattered settlements commonly has a high number of inhabitants connected to small wastewater facilities. Sludge separators, or alternatively in combination with an after-infiltration, constitute the most common treatment methods for these kinds of plants. This situation is relatively unchanged compared to 2003.
Around half the amount of sewage sludge used as fertilizer
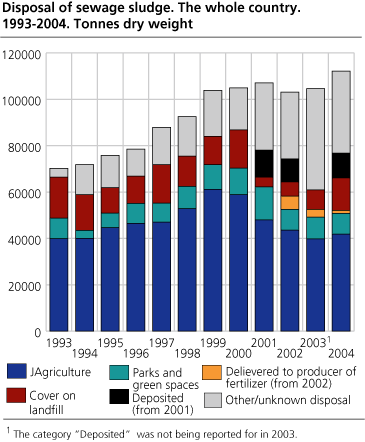
In 2004, the municipal reports on sewage sludge show a total of 112 000 tonnes dry weight used for different purposes, a 7 per cent increase since 2003. Around 46 per cent of the amount was used as fertilizer and soil improvement in agriculture, park and green spaces or delivered to producers of fertilizers.
Higher connection fees in less populated municipalities
Municipal wastewater fees are in accordance with full cost regulations set by the municipal authorities and should be reflected in the fee level, and above all not exceed the municipal cost of the service with revenues collected by fees. The fee level generally varies due to differences in type of settlement patterns and geographical characteristics.
The connection fee is a one-time payment by the user at the time of connecting to the existing wastewater pipeline-system. In 2005, connection fee was on the average 12 727 NOK in 2005 (VAT excluded), a decrease of around 2 per cent compared to the year before. If weighted against municipal population numbers, then the fee is reduced to 12 212 NOK.
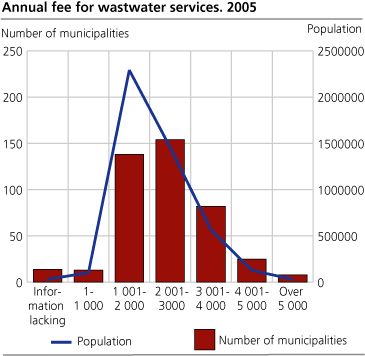
The annual fee is paid regularly, and the fee level was on the average 2 480 NOK per year in 2005 (VAT excluded). When weighted against municipal population numbers, the annual fee is reduced to 2 120 NOK. This is at about the same level as last year. Some users pay per volume wastewater discharged, and this fee was on the average 10.5 NOK per cubic metre.
For further information about the economy in municipal waste water sector, please refer to the report Analysis of physical data from the wastewater treatment sector 2003 (report 2005/06) .
The report “Fees and physical data in the municipal wastewater treatment sector 2004” is planned to be published in the beginning of March 2006. The basic data from the report can, however, be found in StatBank .
Contact
-
Gisle Berge
E-mail: gisle.berge@ssb.no
tel.: (+47) 48 12 19 97

