Content
Published:
This is an archived release.
Best waste water treatment in east and south
The average treatment efficiency for phosphorus in municipal waste water treatment plants is highest in the counties from Østfold to Vest-Agder (the North Sea counties), with 92.9 per cent. Waste water treatment plants in the counties from Rogaland and northwards have an average treatment efficiency of 28.1 per cent.
The reason for this low treatment efficiency in the western and northern counties is simply that there is no need for better treatment due to good conditions in recipients (coastal waters, rivers and lakes), and as a result regional and local authorities are allowed to make less strict demands when it comes to removal of pollutants at waste water treatment plants.
When it comes to waste water treatment, the pollution authorities in Norway have mainly focused on discharges of phosphorus. The reason for this is the important role phosphorus plays in eutrofication of rivers, lakes and coastal waters. In addition, waste water treatment plants discharge various amounts of nitrogen, organic matter and heavy metals.
836 tonnes phosphorus from municipal waste water treatment plants
80 per cent of the population in Norway is connected to municipal sewerage systems. Most of these (about 91 per cent) are connected to municipal treatment plants, while the others (9 per cent) are connected to smaller, private treatment plants. In the municipalities around the inner parts of the Oslo fjord, a total of 98 per cent are connected to municipal waste water treatment plants.
In 1999 total discharges of phosphorus from treatment plants were estimated to almost 640 tonnes. In addition, a total of almost 197 tonnes were discharged from sewerage systems with no treatment. Total discharges of phosphorus (does not include leakages from joints and fractured pipes) from municipal sewerage systems were 836 tonnes. For the country as a whole, the average treatment efficiency in municipal waste water treatment plants was 69 per cent, compared with 66 per cent in 1998. In 1999, 1 850 tonnes of phosphorus were removed from the waste water and retained as a component of sewage sludge.
When it comes to nitrogen, the average treatment efficiency was only 24 per cent in 1999, but some counties distinguish themselves with higher efficiencies, for example Oslo and Akershus with 44 per cent, Oppland with 29 per cent and Aust-Agder with 26 per cent. This can be explained by the fact that the Norwegian Pollution Control Authorities have given financial support for upgrading some large treatment plants from chemical to chemical/biological treatment in these counties. Lowest treatment efficiencies are found in Finnmark (6 per cent) and Møre og Romsdal (9 per cent), which is due to the many sewerage systems with no treatment in these two counties. Total discharges of nitrogen are estimated to 13 550 tonnes, and 4 300 tonnes of nitrogen were removed from the waste water at the treatment plants.
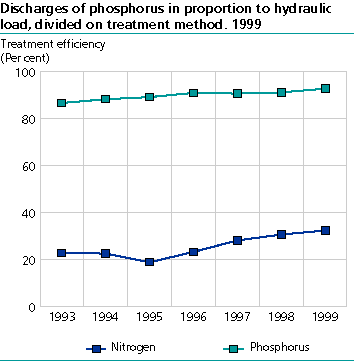
From 1993 onwards there has been a steady increase in total treatment efficiencies for phosphorus and nitrogen in the counties that drain into the North Sea. In 1999, total treatment efficiencies for phosphorus and nitrogen have been estimated to 92.9 per cent and 32.0 per cent, respectively.
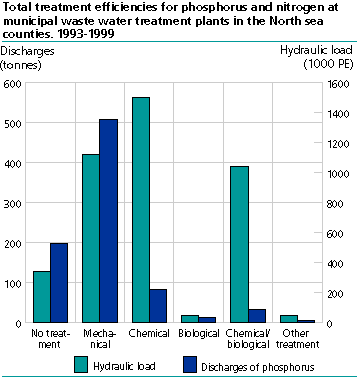
Sewerage systems with no treatment and mechanical treatment plants account for a substantial share of total discharges, 23.5 per cent and 60.8 per cent respectively, even though they transport/treat only a minor part of total waste water quantities. For chemical/biological treatment plants the result is the opposite, these are responsible for only 3.9 per cent of total discharges even though they treat 25.4 per cent of total waste water. Sewerage systems with discharges of untreated waste water and mechanical treatment plants are mainly found along the coast from Rogaland and northwards, while advanced chemical and chemical/biological treatment plants are most common in southern and eastern parts of Norway.
Investments in sewage treatment have reduced pollution loads
The last 20 years substantial resources have been invested in sewage treatment, and these investments have resulted in reduced pollution loads to inland and coastal waters. Our data indicate that there is a close relationship between annual fees per household, which roughly reflect investments the last 20 years, and treatment efficiency for phosphorus.
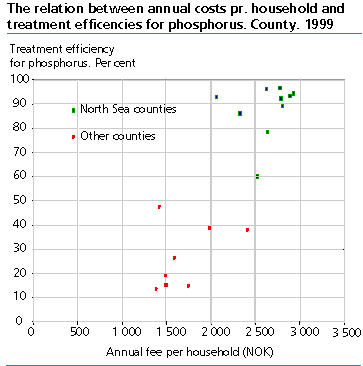
For several years, The North Sea counties have had high standards imposed on them for waste water treatment, which have resulted in high investments and high treatment efficiencies for phosphorus. The other counties have had lower standards imposed since conditions in recipients have been much better and pollution loads lower, with the consequence that investments and treatment efficiencies are much lower than in the North Sea counties.
It needs to be said that not all investments will lead to higher treatment efficiencies. Examples are investments in pipelines and sludge treatment facilities. In addition, not all municipalities are charging their inhabitants for all costs in this sector. These are factors that will make the relationship between annual fees pr. household and treatment efficiency for phosphorus less obvious.
Lower treatment efficiency at separate (private) treatment plants
20 per cent of the population in Norway is connected to small, private treatment plants, and these are most often found in scattered settlements. Discharges of phosphorus from these treatment plants are estimated to 342 tons in 1999, giving an average treatment efficiency of 34 per cent. In other words, the average treatment efficiency for these plants was about the half of municipal waste water treatment plants. A total of 180 tonnes of phosphorus were removed from the waste water before it was discharged to recipients. For nitrogen the average treatment efficiency was estimated to only 16 per cent. 620 tonnes of nitrogen were removed from the waste water at these plants.
69 per cent of the sewage sludge used as fertiliser
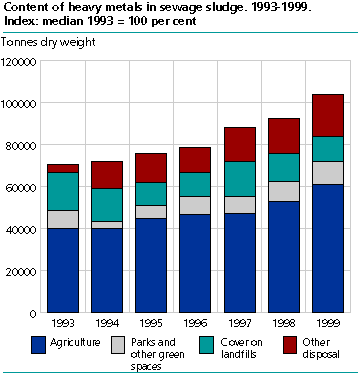
Sludge is a residual product of waste water treatment plants, and contains both organic matter and plant nutrients. This means that sludge is a valuable resource that can be used as fertiliser on farmland, parks and other green spaces. In 1999, the total amount of sludge disposed, expressed as dry weight, was estimated to 103 898 tonnes, an increase of 12 per cent from 1998. Of this, 69 per cent was used as fertiliser on agricultural areas, parks and other green spaces, while 12 per cent was applied as cover on waste landfills.
Heavy metals in sludge
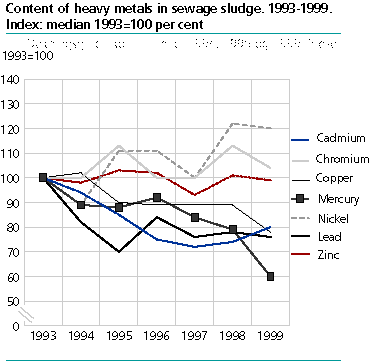
The composition of sewage sludge produced, including its content of heavy metals, varies substantially from one plant to another depending on the type of treatment and the amount and type of waste water. If the content of heavy metals exceeds the limit values, the sludge cannot be used on agricultural areas or parks and other green spaces. In 1999, the disposed sludge contained an estimated 110 kg of cadmium and 95 kg of mercury.
When considering the content of heavy metals in sludge, there seems to be a decrease in levels of mercury, copper, lead and cadmium and an increase in nickel. There are significant variations from year to year and it is therefore not possible to make any reliable conclusions regarding trends for heavy metals in sludge.
| Content of heavy metals, organic matter and nutrients in sewage sludge. 1999 |
| Average for all treatment plants (mg per kg DW) | Highest recorded value (mg per kg DW) | Limit for use in agriculture (mg per kg DW) | Limit for use in parks and other green spaces (mg per kg DW) | Total quantity in disposed sewage sludge (tonnes) | |||||||||||||||||||||||||||||||||||
|---|---|---|---|---|---|---|---|---|---|---|---|---|---|---|---|---|---|---|---|---|---|---|---|---|---|---|---|---|---|---|---|---|---|---|---|---|---|---|---|
| Heavy metal | |||||||||||||||||||||||||||||||||||||||
| Cadmium (Cd) | 0,96 | 12,70 | 2 | 5 | 0,11 | ||||||||||||||||||||||||||||||||||
| Chromium (Cr) | 29,79 | 436,00 | 100 | 150 | 3,05 | ||||||||||||||||||||||||||||||||||
| Copper (Cu) | 248,22 | 1 497,00 | 650 | 1 000 | 24,76 | ||||||||||||||||||||||||||||||||||
| Mercury (Hg) | 0,95 | 24,00 | 3 | 5 | 0,09 | ||||||||||||||||||||||||||||||||||
| Nickel (Ni) | 13,76 | 407,00 | 50 | 80 | 1,56 | ||||||||||||||||||||||||||||||||||
| Lead (Pb) | 24,18 | 150,00 | 80 | 200 | 2,94 | ||||||||||||||||||||||||||||||||||
| Zink (Zn) | 361,29 | 2 907,00 | 800 | 1 500 | 35,07 | ||||||||||||||||||||||||||||||||||
| Organic matter and nutrients | |||||||||||||||||||||||||||||||||||||||
| Organic matter | 62.53 per cent of DW | 64 967 | |||||||||||||||||||||||||||||||||||||
| Kjeldahl-N | 2.82 per cent of DW | 2 930 | |||||||||||||||||||||||||||||||||||||
| Ammonium-N | 0.31 per cent of DW | 322 | |||||||||||||||||||||||||||||||||||||
| Total phosphorus (P) | 1.62 per cent of DW | 1 683 | |||||||||||||||||||||||||||||||||||||
| Potassium (K) | 0.17 per cent of DW | 177 | |||||||||||||||||||||||||||||||||||||
| Calcium (Ca) | 3.30 per cent of DW | 3 429 | |||||||||||||||||||||||||||||||||||||
Tables:
Contact
-
Gisle Berge
E-mail: gisle.berge@ssb.no
tel.: (+47) 48 12 19 97