Content
Published:
This is an archived release.
107 kg cadmium from municipal wastewater
Estimates for 2010 show that Norwegian wastewater facilities discharged around 42 kg of cadmium into fresh waterways and coastal areas, while 65 kg adsorbs into sewage sludge - a total of 107 kg.
This is revealed in the new report Municipal wastewater: Expenditures, investments, discharges, treatment and disposal of sewage sludge 2010 - Wastewater fees 2011 (in Norwegian only, with an English abstract).
In comparison to national discharge and emission data, cadmium from wastewater constitutes around 7 per cent of the total (according to Miljøstatus the total discharges and emissions in 2008 were around 1.5 tonnes). Cadmium is considered to be acutely and chronically poisonous to animals and humans, and the authorities request a continuous reduction of discharges and eventually a complete halt in use and discharge by the year 2020.
Furthermore, in 2010, the total level of mercury from wastewater amounted to 72 kg, while lead totalled 3 200 kg.
|
Total amount
in sewage sludge and treated wastewater |
Amount in
treated wastewater |
Amount in
sewage sludge1 |
|||||||||||||||||||||||||||||||||||||||||||||||||||||||||||||||||||||||||||||
|---|---|---|---|---|---|---|---|---|---|---|---|---|---|---|---|---|---|---|---|---|---|---|---|---|---|---|---|---|---|---|---|---|---|---|---|---|---|---|---|---|---|---|---|---|---|---|---|---|---|---|---|---|---|---|---|---|---|---|---|---|---|---|---|---|---|---|---|---|---|---|---|---|---|---|---|---|---|---|---|
| Kilogrammes | |||||||||||||||||||||||||||||||||||||||||||||||||||||||||||||||||||||||||||||||
| Arsenic (As) | . | 500 | . | ||||||||||||||||||||||||||||||||||||||||||||||||||||||||||||||||||||||||||||
| Cadmium (Cd) | 107 | 42 | 65 | ||||||||||||||||||||||||||||||||||||||||||||||||||||||||||||||||||||||||||||
| Chromium (Cr) | 4 952 | 2 400 | 2 552 | ||||||||||||||||||||||||||||||||||||||||||||||||||||||||||||||||||||||||||||
| Copper (Cu) | 29 526 | 10 000 | 19 526 | ||||||||||||||||||||||||||||||||||||||||||||||||||||||||||||||||||||||||||||
| Mercury (Hg) | 72 | 17 | 55 | ||||||||||||||||||||||||||||||||||||||||||||||||||||||||||||||||||||||||||||
| Nickel (Ni) | 5 161 | 3 500 | 1 661 | ||||||||||||||||||||||||||||||||||||||||||||||||||||||||||||||||||||||||||||
| Lead (Pb) | 3 166 | 1 300 | 1 866 | ||||||||||||||||||||||||||||||||||||||||||||||||||||||||||||||||||||||||||||
| Zinc (Zn) | 67 859 | 30 000 | 37 859 | ||||||||||||||||||||||||||||||||||||||||||||||||||||||||||||||||||||||||||||
| 1 |
Estimation based on average content of heavy metals in sewage
sludge and amount of sludge disposed. |
Where do heavy metals in wastewater come from and where do they go?Heavy metals in wastewater originate mainly from storm water (run-off from roads and streets) and cleaning and maintenance of cars and bikes, and by washing clothes). Wastewater is generally a minor source for heavy metals. At the treatment plants, part of the heavy metals will adsorb into the sewage sludge - removed from the water phase - while another part will pass through the plant, released into the waterways together with treated wastewater. |
Three out of five connected to high-grade treatment
In 2010, 59 per cent of Norway’s population were connected to high-grade treatment plants - biological and/or chemical treatment. This is the same level as last year. Chemical/biological treatment as opposed to mechanical treatment can remove more of the pollutants from the wastewater before being discharged into rivers and water systems. This applies in particular to phosphorous and organic material, but also other types of pollutants.
Furthermore, the statistics show that 21 per cent of the population were connected to mechanical or other types of treatment, 4 per cent had direct discharges and the remaining 16 per cent of the population were connected to small wastewater facilities (less than 50 pe).
2 735 wastewater facilities are serving 83 per cent of us
Estimates for 2010 show that a total of 2 735 municipal wastewater facilities (capacity 50 pe or more) were in operation for the whole or part of the year. These wastewater facilities treat wastewater for approximately 83 per cent of the population, which is around the same level as last year.
813 tonnes of phosphorous
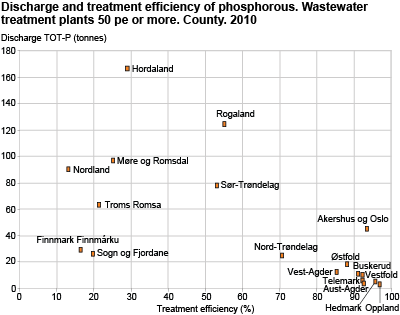
For 2010, the discharges of phosphorous (tot-P) from the municipal wastewater sector have been estimated at 813 tonnes, which is around the same level as last year. Per inhabitant connected, this discharge corresponds to 0.20 kg.
The phosphorous treatment efficiency of the wastewater sector as a whole has been estimated at 69.8 per cent. This constitutes a decrease of 0.8 per cent for phosphorous compared to 2009. Because of the variation in critical levels to withstand pollutants by the water recipients, regional differences in treatment legislations have been set up by the government. Thus, as can be expected, treatment efficiencies differ significantly depending on where you are in the country.
Slight increase in costs of wastewater services
In 2010, the total cost for all municipalities was NOK 5.38 billion. This constitutes an increase of 4.5 per cent compared to the year before. The costs related to the wastewater sector are made up of capital costs and operating costs. The increase mentioned is due to an increase in operating and capital costs. The figures for the entire country are calculated based on the data reported in KOSTRA, with estimates for data missing. The estimates are based on data reported last year and average figures from the groups of municipalities in KOSTRA.
Wastewater fees are determined by the municipalities in accordance with the full cost principle. Local conditions such as patterns of built-up areas, topography, bedrocks in the ground, the need for pumping stations and treatment requirements are factors behind the variation in fees.
Income from fees does not cover all costs
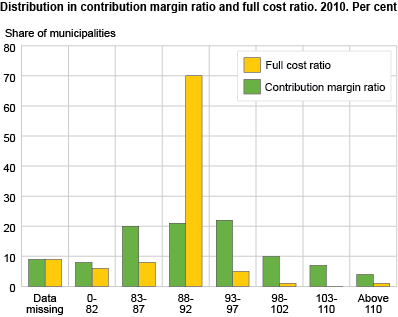
A total of 47 per cent of the population live in municipalities with a contribution margin ratio of less than 100 per cent, which means that the incomes from fees are below the fee calculation basis.
At the same time, a total of 66 per cent of the municipalities have a full cost ratio between 98 and 102 per cent, and these municipalities are home to 75 per cent of the population. A major part of the population lives in municipalities where the costs for wastewater services are covered by fees.
The full cost ratio reflects the relationship between the income from fees and the fee calculation basis, and includes fund provisions and purchases from funds.
Contact
-
Gisle Berge
E-mail: gisle.berge@ssb.no
tel.: (+47) 48 12 19 97


