Content
Published:
Continued decrease in investment levels
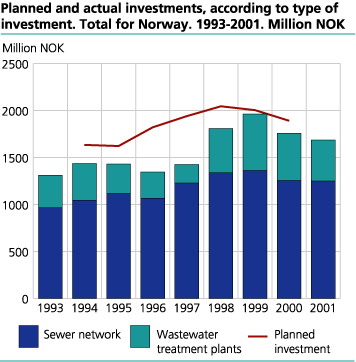
Investments in the wastewater sector continued to decrease in 2001 when compared with 1999 which had the highest investment level to date. At the same time the municipalities covered less of their total costs through fees than was expected based on the trend of the past few years.
This conclusion is based on calculations that Statistics Norway has made using the data reported to the KOSTRA-system (municipal-state reporting system).
Investments continue to decrease
Total investments in the municipal wastewater sector in 2001 were 1.69 billion NOK. Investments of 436 million NOK were made in wastewater treatment plants and 1 250 million NOK were used for the sewer network.
The figure shows the investments in the municipal wastewater sector from 1993 to 2001 according to the type of investment. During the entire period, investment in the sewer network accounted for the largest proportion of t total investment in the wastewater sector. The overall investment picture shows a continuing decrease in the investment level in comparison with the 1999 that was the year with the highest investment level on record. Investments in the sewer network have been more stable than investments in treatment plants.
Increased annual costs but also changes in calculation methods
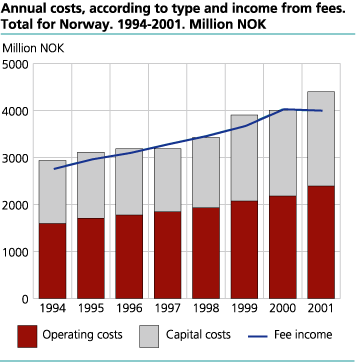
The municipalities' annual costs connected to the wastewater sector show a relatively constant increase over the entire period from 1994 to 2001. Capital costs are dependent on interest rates and therefore vary a bit more from year to year than do operating costs. In 2001, capital costs were NOK 2.00 billion while operating costs were NOK 2.39 billion.
The figure also shows the developments regarding income from fees during the time period from 1994-2001. While costs have increased since 2000, income from fees is at approximately at the same level.
Changes in both the income from fees and the annual costs from 2000 to 2001 can, however, be due largely to changes in the data source and in the calculation methods rather than due to changes from other sources. In a number of situations the new calculation method results in generally lower capital costs, while in other situations the conversion to the new municipal accounting system and definitions leads to higher annual costs. At the same time, there is a relatively high level of uncertainty connected to the statistics in general because of the new calculation method used to determine annual costs. For some municipalities will this result in higher values than previously, while for other municipalities the result is just the opposite. Therefore, comparing the values for 2001 with earlier years should be done with caution.
Lower cost coverage in 2001
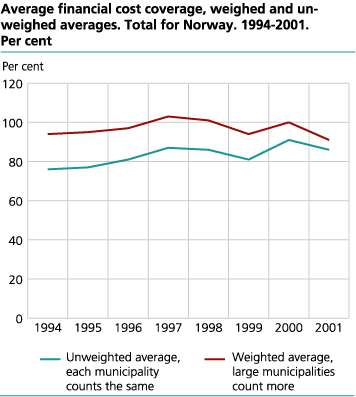
In 2001 the municipal wastewater sector costs were NOK 4.40 billion. NOK 3.99 billion were collected as income from wastewater fees for the same year. On a national basis, 91 per cent of the municipalities' costs were covered by the fee income.
There are, however, large differences between the municipalities. A number of municipalities continue to subsidize the wastewater sector, although increasingly more municipalities decide to have full cost coverage for wastewater services. If an average is calculated for the relationship between income from fees and annual costs, where each municipality has the same weight, then this average cost coverage is 86 per cent. In other words, there is a tendency that the larger municipalities have a high cost coverage than the smaller municipalities. This has been the trend for the entire period since 1994.
|
Changes in the standards for annual costs and income from fees
The reporting routines for the basic data used as the foundation for these statistics has been changed from the SESAM system (System for Effective Case Handling in the Environment departments) to the KOSTRA system (Municipal - State reporting). At the same time the data to be reported has also been changed. In the earlier reporting system, the municipalities reported specific economic parameters that were used in the calculations for the statistics, now the basic data are obtained directly from the municipal accounts. Different accounting practices in the municipalities will therefore have consequences for these statistics. In addition to different accounting practices, errors in the bookkeeping will also have consequences for these statistics. The municipal accounts for wastewater services have to some degree been revised by Statistics Norway particularly when systematic errors in the use of specific accounts have been identified in many municipalities. Specific errors are not as easy to identify to the individual municipality, even though the total values for Norway show large changes. The calculation method for capital costs has been re-defined in accordance with the KOSTRA accounting system changes that have been implemented by all of the municipalities for the accounting year 2001. Now the methods used to calculate depreciation and calculated interest costs follow the recommendations of the Ministry of Local Government and Regional Development (KRD). Changes in the method used for depreciation will provide different results between the municipalities, while the change in the method for calculating the calculated interest costs will, in general, lead to lower values. Some changes will influence the calculations in a certain direction while other changes, accounting practices or errors in the bookkeeping will affect the values in different ways for each individual municipality. It is difficult, therefore, to say anything definitive with respect to the changes in this year's values with respect to those from last year, except that there is a higher level of uncertainty in this year's values. For additional information on the data sources, calculation methods and uncertainty see About the Statistics. |
Many different fee systems and large variations
Connection fees continue to vary the most between municipalities. The highest type of connection fee (the connection fee in non-developed area) varies between NOK 0 and 80 200.
The fees reported are for a standard dwelling of 120 m2. It is difficult, however, to compare fee levels between the municipalities because they operate with such different fee categories and different fee types. Since last year, the municipalities have been required to offer a fee type where the subscribers can pay according to use, if the subscribers want to. The municipality can also require the subscribers to pay according to use. The municipalities are also encouraged to offer a two-part fee type, which reflects to a high degree the constant and the variable costs connected to the production of the service. However, most subscribers continue to pay according to annual fee. This annual fee varies from NOK 450 to NOK 6 765.
See also a separate article for municipal fees for households: http://www.ssb.no/english/subjects/05/03/kommgeb_en/
Tables:
- Table 1 Investment, costs, income, cost coverage ratio and number of connected inhabitants. Municipal figures. 2001
- Table 2 Wastewater treatment fees, for a private dwelling of 120 m2. Municipal figures. 2002. NOK
- Table 3 Investment, by county and region. 1993-2001. Million NOK
- Table 4 Investment in the municipal wastewater sector, according to category of investment, county and region. 2001. Million NOK
- Table 5 Annual costs, by county and region. 1994-2001. Million NOK
- Table 6 Annual costs, according to type, county and region. 2001. Million NOK


