Content
Published:
This is an archived release.
Investments declined
Preliminary figures show that the municipalities invested NOK 1.77 billion in the waste water sector in 2000. This means a decrease of 10 per cent compared with 1999 when NOK 1.96 billion were invested. The changes in investment level vary considerably between counties.
This is the 8th year that Statistics Norway produces statistics on the investments in the municipal waste water sector. During the 8-year period for which statistics have been produced, the investments in 1998 and 1999 where considerably higher than in other years. Mean annual investment during this period is NOK 1.80 billion, calculated in constant 2000-kroner.
As the figure shows, a planned decrease in investments in 2000 has taken place. The actual investments were, as in previous years, lower than planned. However, the gap between planned and actual investments has declined the last two years.
In the earlier 1990s, the government granted financial support for the municipalities' investments in the waste water sector. This is no longer the case. The municipalities now have to finance the sector themselves, which is mainly done through the fees paid by the users of the services, but also, to some extent, through tax revenues.
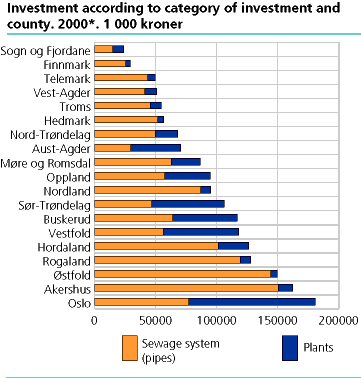
The investments done in the renewal and extension of the sewage pipe system accounted for 72 per cent of total investments in 2000. This has been the pattern during the entire 8-year period. When adding up the 8 years' investment figures, total investments in treatment plants account for only 25 per cent of the total investments made in the municipal waste water sector.
Large differences between the counties
The investments vary greatly between counties. Even though the main part of the investments, for the country as a whole, was done in sewage pipes, investments in treatment plants were considerable in several counties in 2000. In Oslo, Vestfold, Sør-Trøndelag and Aust-Agder the investments in treatment plants made up more than 50 per cent of the total investments in the waste water treatment sector. In Oslo, 57 per cent of the county's/municipality's investments, was used on a nitrogen removal plant.
Investments vary strongly from one year to another, and should therefore be considered in a long perspective to get a more proper picture of the conditions in the sector. The figure shows the investments for the entire period 1993-2000, calculated in 2000-NOK and then added up. During this period, Hordaland has invested far more than Oslo, who had the largest investment during 2000. However, several municipalities made important investments in the wastewater treatment sector, even before the statistics started.
Because of lack of data from several municipalities, it has been necessary to estimate investments for these municipalities. The estimates are based on previous years' planned investments. Since, traditionally, the planned investments have been larger than the actual investments, investment figures for 2000 might be overestimated for some counties. This is especially the case for Oppland, and to some extent Aust-Agder and Nordland.
Final figures for investments, costs and fee levels for the municipal waste water sector 2000 will be published in week 46.
Tables:
- Table 1 Net investment, grants provided from the government and planned investment. The whole country. 1993-2000. Billion 2000 kroner
- Table 2 Investment. According to category of investment, by county. Reported and estimated figures. 2000. 1 000 kroner*
- Table 3 Investment. County figures. 1993-2000. Million kroner


