Content
Published:
This is an archived release.
Fees increase less than costs
The high level of investment, combined with a rise in interest rates, has led to an increase of costs in the wastewater treatment sector of 15 per cent from 1998 to 1999. The fee levels have only increased six per cent during the same period of time.
The total costs in the wastewater treatment sector increased by 15 per cent from 1998 to 1999.
Capital costs rose by 23 per cent, while maintenance, running and overhead costs rose by eight per cent. The consumer price index rose by 2.3 per cent during the same time period.
Record high level of investment
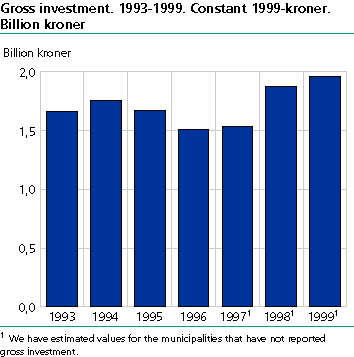
The high level of investment, combined with an increase in interest rates, led to a marked increase in costs in the wastewater treatment sector in 1999. Gross investment in the municipal wastewater sector in 1999 was 1.96 billion kroner. The wastewater statistics cover gross investment figures from 1993 to 1999. In this time period the investment level in 1999 was the highest as calculated in constant kroner. In 1998 and 1999, there has been higher investments in both the systems of sewer lines and in plants with and without nitrogen removal than in previous years.
Larger increase in costs than in income from fees
The fee levels in 1999 were not high enough to cover all the expenses in the wastewater treatment sector. The municipalities had income from annual fee and one-time connection fees of 3.66 billion kroner, whereas the total costs added up to 4.04 billion kroner. This means that on a national basis, 90 percent of the municipalities' costs were covered by fee income. This is a reduction of eight per cent as compared with 1998. On a national basis the municipalities' income was lower than costs during the entire period 1993 to 1999 with the exception of 1997 when income covered 100.1 per cent of costs.
Large differences in fees
The fees have not increased at the same pace as the costs despite the fact that there was a lack of surplus in the wastewater sector in earlier years. The 15 per cent increase in the municipalities' total annual costs from 1998-99 are not reflected in the fees set for the year 2000. From 1999 to 2000 the average one-time connection fee increased by four per cent, the average annual fee level increased by seven per cent and the average per cubic meter fee increased by six per cent. There are very large differences between municipalities. The fee per cubic meter varies from 1.57 kroner in Lyngen in Troms county to 28.45 kroner in Tana in Finnmark county. The national average is 8.96 kroner. The connection fees vary from one krone in the municipalities of Drammen and Porsgrunn to 80 200 kroner in Aurskog-Høland in Akershus county. The national average is 12 729 kroner.
Regulations followed to various degrees
According to the regulation concerning water and wastewater fees, the municipalities should seek to cover the costs in the sector through fees after the principals of own-financing and user-pays. However, it is voluntary for the municipalities whether or not to follow this recommendation. On the other hand, the municipalities do not have the right to cover more than 100 per cent of their costs. In certain circumstances the municipality can collect fee income that is more than their annual costs during a year but it is not allowed to have higher income than expenses for five years taken together. In spite of this, 28 municipalities, with a total of 1.2 million inhabitants, had a income-to-cost ratio of more than 100 per cent for six years in a row. These figures are based on the calculation of capital costs using the annuity method as recommended by The Norwegian Pollution Control Authority and the Ministry of Environment. Municipalities have the option to choose between several different methods for these calculations. The Ministry of Local Government and Regional Development recommends different calculation methods then the one used here.
The level of covering of costs varies strongly, however, between municipalities and this cannot be explained only based on calculation methods. The lowest level of income-to-cost coverage in 1999, based on the reported figures, was eleven per cent and the highest was 487 per cent. Then municipal average was 79 per cent. In the period from 1993 to 1999 the average has varied between 68 and 86 per cent.
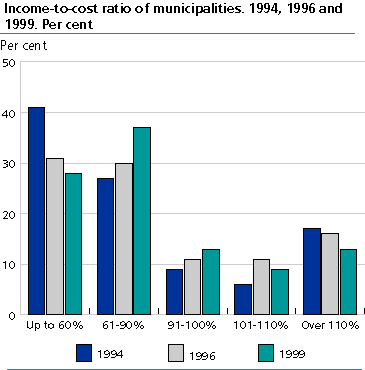
There is a tendency for municipalities to seek to cover a larger part of their costs through income from wastewater fees. Fewer municipalities than before have very low income-to-cost ratios. In 1994, 22 per cent of the municipalities covered less than 40 per cent of their costs through fees. In 1996 this number had fallen to 16 per cent, and in 1999 a further reduction to 11 per cent. The fraction of municipalities with an income-to-cost ratio of over 110 per cent has also been reduced, and the fraction of municipalities with an income-to-cost ratio between 61 and 100 per cent has increased.
Tables:
- Table 1 Gross investment, planned investment, and investment pr. subscriber. Regional and county figures. 1999
- Table 2 Investment in the municipal wastewater sector. According to category of investment. Regional and county figures. 1999. 1 000 kroner
- Table 3 Total annual costs divided by capital costs and maintenance, running and overhead costs. Region and county. Million kroner. 1999
- Table 4 Investment, costs, income, income-to-cost ratio and subscribers. Municipal figures. 1999
- Table 5 Wastewater treatment fees. Municipal figures. 2000. Kroner


