Content
Published:
This is an archived release.
Norwegians throw away more clothing
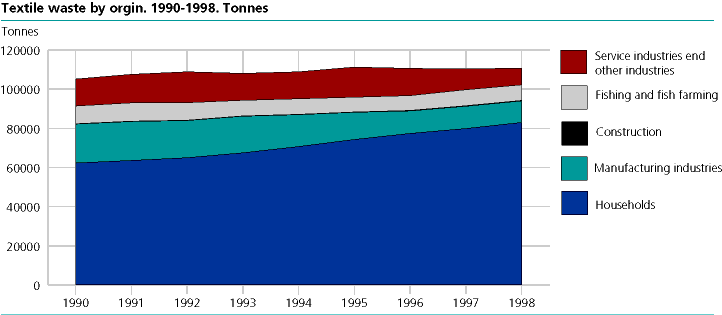
A steadily increasing share of textile waste stems from households. An increasing share of textile waste consists of clothing. In 1998, 110 000 tonnes of textile waste occurred in Norway. By comparison, Norwegians generated around 6.5 million tonnes of waste all told last year.
The amount of textile waste in Norway has remained relatively stable throughout the 1990s.
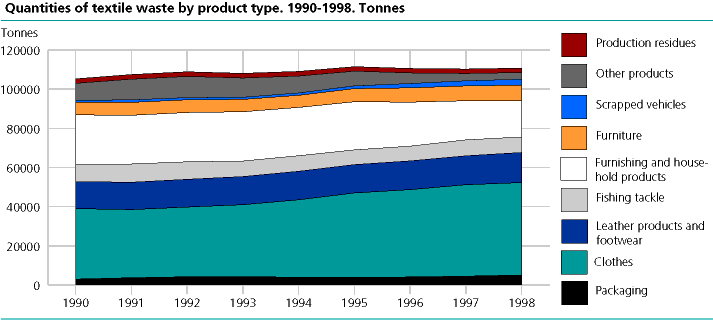
In 1998, nearly 75 per cent of textile waste came from households, with clothing making up 40 per cent of the total amount. Two-thirds of the waste landed in dumps in 1996.
Textiles cover natural or synthetic fibres and various mixtures of these, as well as products made of such fibres. Raw materials are for example wool, cotton, silk, linen, cellulose and oil. The manufacture of textiles is a resource-intensive process and generates emissions to air and water. Increased reuse and recycling of textile waste, which today ends up in the dump, could reduce energy consumption and pollution.
Most from households
The main source of textile waste is households, which contributed 83 000 tonnes or 75 per cent in 1998. The primary household textile waste is clothing. Manufacturing accounted for 10 per cent, fishing, whaling and aquaculture for seven per cent and the rest of the industries, of which service industries make up the majority, accounted for eight per cent of the total amount of waste in 1998. The trend is that the households total amounts of waste and also the share of textile waste have increased steadily, while the manufacturing and service industries' share has fallen. This is connected with the increased share of clothing in textile waste. The construction industry generates little textile waste, The figures are uncertain, particularly in the case of service industries.
We throw more clothes
If we look at the type of products that result in textile waste, clothing made up the largest share, accounting for 43 per cent in 1998. The clothing figures show a steady increase during the period, from ca. 34 800 tonnes in 1991 in 47 200 tonnes in 1998. Clothing, leather products and footwear made up 57 per cent of the amount of waste. Seventeen per cent of the textile waste in 1998 was made up of interior decorating textiles such as wall coverings, carpets, curtains and the like. Other products contain inter alia technical textiles and treated textile products such as tents and camping equipment, parasols, umbrellas and awnings. Like interior decorating textiles, these declined in 1990-1998, from 8 per cent in 1990 to three per cent in 1998. With respect to technical textiles, the decline is probably connected to the decline in textile industry output during the same period. There was also a small percentage of packaging, accounting for 4.3 per cent of the total amount of textile waste in 1998.
Most ends up in landfills
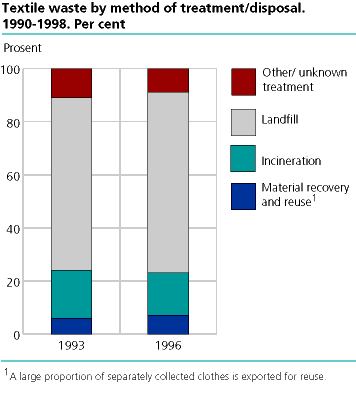
Altogether 68 per cent of the textile waste that occurred in Norway in 1996 ended up in landfills. Sixteen per cent was burned. Only seven per cent of the total amount was recycled or reused. A large share of what was collected for recycling or reuse was exported to countries in the Third World and Eastern Europe as development aid. A small portion was recycled or sold through various enterprises such as the Salvation Armys Fretex companies, UFF and jumble sales. There have been discussions on whether clothing collected for reuse should be counted or not as waste. It has nevertheless been included in these statistics.
There has been a small change in processing between 1993 and 1996. There was a small increase in material recycling and reuse and a decline in incineration, but the breakdown between incineration and landfilling is uncertain. It is consequently difficult to conclude any trend here.
Tables:
The statistics is published with Waste accounts.
Contact
-
Statistics Norway's Information Centre
E-mail: informasjon@ssb.no
tel.: (+47) 21 09 46 42


