Content
Published:
This is an archived release.
Reduced amounts for the first time in 2009
In Norway, 10.4 million tonnes of waste were generated in 2009, down 5 per cent from the previous year. This is the first time since the waste accounts began that the waste amounts fell. A total of 78 per cent of the waste being handled in known ways was recovered, excluding hazardous waste.
These are results from Statistics Norway’s new estimations on waste generation and handling in industries and households. The figures for 2009 and 2008 are preliminary.
In addition, 1.3 million tonnes of slightly polluted matter from construction work were deposited at landfill sites.
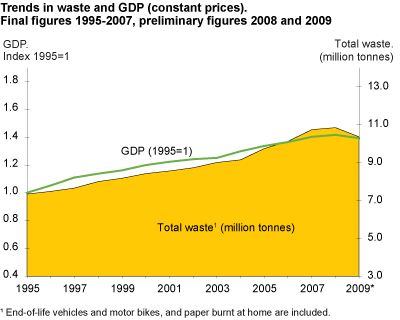
The waste amounts dropped more than the GDP (fixed prices), which fell by 1 per cent in the same period. A Norwegian national target set by the authorities in 1999 has been to bring the growth in waste amounts to a level that is considerably lower than the economic growth, expressed by GDP. The overall waste growth since 1995 was 41 per cent, while the GDP grew 40 per cent.
The waste amounts from households declined 2 per cent from 2008 to 2009, while the decline in industrial waste was somewhat steeper in the same period, at 5 per cent. This is consistent with the development in recent years, where the household waste comprises an increasingly bigger share of the total waste amount. Households now generate 21 per cent of all waste in Norway (Corrected 28.10.2010).
Less degradable material going to landfill
The amount of landfilled waste declined by 11 per cent to 1.9 million tonnes in 2009, of which 0.5 million tonnes was organic matter that decomposes and generates methane, a potent greenhouse gas. The amount of degradable material going to landfill dropped by as much as 18 per cent in 2009, partly due to a ban on the landfilling of bio-degradable waste entering into force on 1 July 2009, and increased export to Sweden for incineration. The slightly polluted matter from construction work comes in addition.
Hazardous waste disposed of at specially engineered landfills was by far the biggest portion, making up slightly more than one third of the landfilled volumes. The remaining amounts were concrete, glass, plastic, etc., which degrades very slowly in the landfills. The split of landfilled waste by material is somewhat uncertain due to a limited data basis.
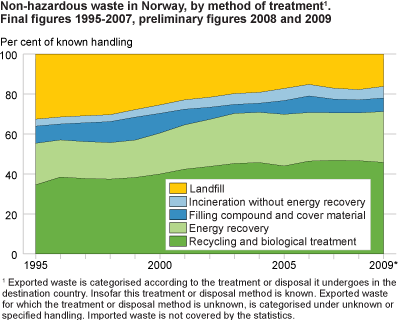
6.0 million tonnes of non-hazardous waste were sent for recovery in 2009, comprising 78 per cent of all non-hazardous waste this year. This recovery rate has been fairly stable since 2006. Recycling comprised 3.2 million tonnes, or 40 per cent, while energy recovery counted for 25 per cent. The remainder was either biologically treated (e.g. composting) or used as filling compound or cover material at landfills. The recycled share of the total recovery dropped slightly in 2009, while the other recovery forms increased accordingly. Hazardous waste and waste handled in other or unknown ways are excluded from the estimation of recovery rates.
The recovery level varies considerably between the different materials, due to the feasibility of producing useful raw material from the sorted waste, and the market situation for the raw material. As metals and paper have had high recovery rates for several years, and reached 92 and 80 per cent in 2009 respectively, the share of plastics sent for recovery reached 57 per cent the same year.
Decline in all materials
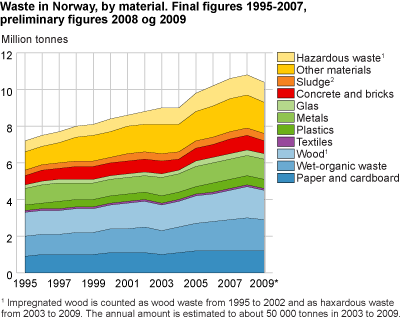
All material types showed reduced amounts in 2009, with concrete and bricks having the greatest reduction by approximately 13 per cent from the previous year due to reduced building activity. Wet-organic waste was still the largest material portion in 2009, with 1.7 million tonnes. The overall amount of wet-organic waste dropped 3 per cent from the previous year, and the landfilled amount dropped as much as 21 per cent.
The hazardous waste amount showed an increase from 1995 by 67 per cent, but a decline of approximately 6 per cent from the previous year. Incomplete registering of hazardous waste in the beginning of the period may be an important reason. The preliminary estimation of hazardous waste volumes in 2009 is regarded to be somewhat uncertain.
The amount of paper waste has declined in recent years, and was 5 per cent lower in 2009 than in 2007.
Less waste from building activity
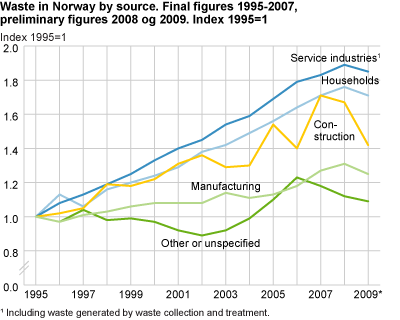
Waste from construction and demolition industries fell by 15 per cent to 1.2 million tonnes in 2009, excluding clean and slightly polluted soils and rocks. The trend after 2004 is somewhat uncertain, but is believed to be as shown in figure 2 based on the annual amount of built area.
The service industries generated 1.9 million tonnes of waste in 2009, comprising 18 per cent of the total national amounts. This includes waste arising from waste handling. This is down 2 per cent from the previous year, but up as much as 85 per cent since 1995. About half the waste was delivered as mixed waste.
The waste amounts in the manufacturing industries are estimated at 3.9 million tonnes in 2009, which is down 4 per cent from 2008. This makes up 37 per cent of the national waste total. About three quarters of this stemmed from production processes.
Due to a new classification standard for industries, businesses belonging to the category of waste recovery have moved from manufacturing to service industries.
| Total1 |
Paper, cardboard
and pasteboard |
Metals | Plastics | Glas | Wood waste | Textiles | Wet organic waste | Concrete and bricks | Sludge | Other | Hazardous waste | ||||||||||||||||||||||||||||||||||||||||||||||||||||||||||||||||||||
|---|---|---|---|---|---|---|---|---|---|---|---|---|---|---|---|---|---|---|---|---|---|---|---|---|---|---|---|---|---|---|---|---|---|---|---|---|---|---|---|---|---|---|---|---|---|---|---|---|---|---|---|---|---|---|---|---|---|---|---|---|---|---|---|---|---|---|---|---|---|---|---|---|---|---|---|---|---|---|---|
| 1995 | 7 342 | 887 | 919 | 327 | 189 | 1 328 | 109 | 1 070 | 533 | 328 | 1 020 | 632 | |||||||||||||||||||||||||||||||||||||||||||||||||||||||||||||||||||
| 1996 | 7 488 | 980 | 956 | 349 | 179 | 1 327 | 113 | 1 086 | 554 | 323 | 997 | 625 | |||||||||||||||||||||||||||||||||||||||||||||||||||||||||||||||||||
| 1997 | 7 654 | 976 | 959 | 360 | 182 | 1 300 | 115 | 1 112 | 571 | 329 | 1 134 | 617 | |||||||||||||||||||||||||||||||||||||||||||||||||||||||||||||||||||
| 1998 | 8 002 | 1 009 | 945 | 366 | 189 | 1 301 | 116 | 1 182 | 655 | 328 | 1 303 | 609 | |||||||||||||||||||||||||||||||||||||||||||||||||||||||||||||||||||
| 1999 | 8 182 | 1 031 | 934 | 374 | 191 | 1 263 | 115 | 1 236 | 669 | 334 | 1 432 | 601 | |||||||||||||||||||||||||||||||||||||||||||||||||||||||||||||||||||
| 2000 | 8 408 | 1 081 | 936 | 380 | 198 | 1 311 | 113 | 1 270 | 658 | 344 | 1 445 | 672 | |||||||||||||||||||||||||||||||||||||||||||||||||||||||||||||||||||
| 2001 | 8 555 | 1 071 | 940 | 388 | 208 | 1 367 | 112 | 1 302 | 690 | 357 | 1 477 | 642 | |||||||||||||||||||||||||||||||||||||||||||||||||||||||||||||||||||
| 2002 | 8 722 | 1 060 | 935 | 400 | 219 | 1 420 | 111 | 1 363 | 697 | 371 | 1 490 | 658 | |||||||||||||||||||||||||||||||||||||||||||||||||||||||||||||||||||
| 2003 | 9 011 | 1 017 | 953 | 414 | 232 | 1 438 | 111 | 1 349 | 657 | 381 | 1 593 | 867 | |||||||||||||||||||||||||||||||||||||||||||||||||||||||||||||||||||
| 2004 | 9 141 | 1 092 | 994 | 426 | 231 | 1 385 | 113 | 1 413 | 634 | 384 | 1 542 | 927 | |||||||||||||||||||||||||||||||||||||||||||||||||||||||||||||||||||
| 2005 | 9 747 | 1 177 | 1 054 | 437 | 251 | 1 481 | 116 | 1 490 | 739 | 408 | 1 627 | 966 | |||||||||||||||||||||||||||||||||||||||||||||||||||||||||||||||||||
| 2006 | 10 109 | 1 226 | 1 097 | 467 | 254 | 1 471 | 118 | 1 628 | 687 | 380 | 1 695 | 1 085 | |||||||||||||||||||||||||||||||||||||||||||||||||||||||||||||||||||
| 2007 | 10 739 | 1 235 | 1 105 | 492 | 278 | 1 626 | 124 | 1 743 | 821 | 401 | 1 836 | 1 077 | |||||||||||||||||||||||||||||||||||||||||||||||||||||||||||||||||||
| 2008* | 10 858 | 1 188 | 1 134 | 507 | 281 | 1 664 | 130 | 1 778 | 804 | 404 | 1 845 | 1 123 | |||||||||||||||||||||||||||||||||||||||||||||||||||||||||||||||||||
| 2009* | 10 400 | 1 200 | 1 100 | 510 | 270 | 1 600 | 130 | 1 700 | 700 | 390 | 1 700 | 1 100 | |||||||||||||||||||||||||||||||||||||||||||||||||||||||||||||||||||
| By source and material (2008*) | |||||||||||||||||||||||||||||||||||||||||||||||||||||||||||||||||||||||||||||||
| Total | 10 858 | 1 188 | 1 134 | 507 | 281 | 1 664 | 130 | 1 778 | 804 | 404 | 1 845 | 1 123 | |||||||||||||||||||||||||||||||||||||||||||||||||||||||||||||||||||
| Households2 | 2 186 | 475 | 205 | 153 | 79 | 372 | 52 | 555 | 3 | 0 | 262 | 28 | |||||||||||||||||||||||||||||||||||||||||||||||||||||||||||||||||||
| Agriculture, forestry and fishing | 145 | 7 | 12 | 22 | 41 | 41 | 4 | 97 | 0 | 0 | 41 | 2 | |||||||||||||||||||||||||||||||||||||||||||||||||||||||||||||||||||
| Mining and quarrying | 206 | 10 | 23 | 4 | 41 | 11 | 41 | 8 | 8 | 0 | 9 | 130 | |||||||||||||||||||||||||||||||||||||||||||||||||||||||||||||||||||
| Manufacturing | 4 031 | 205 | 222 | 69 | 49 | 763 | 12 | 700 | 134 | 296 | 950 | 632 | |||||||||||||||||||||||||||||||||||||||||||||||||||||||||||||||||||
| Electricity, gas and water supply | 49 | 1 | 4 | 41 | 0 | 2 | 0 | 41 | 1 | 0 | 1 | 37 | |||||||||||||||||||||||||||||||||||||||||||||||||||||||||||||||||||
| Construction | 1 461 | 19 | 62 | 15 | 83 | 237 | 44 | 428 | 655 | 0 | 344 | 13 | |||||||||||||||||||||||||||||||||||||||||||||||||||||||||||||||||||
| Service industries | 1 947 | 471 | 140 | 155 | 53 | 208 | 446 | 389 | 4 | 107 | 277 | 95 | |||||||||||||||||||||||||||||||||||||||||||||||||||||||||||||||||||
| Other or unspecified | 834 | 0 | 466 | 88 | 15 | 69 | 11 | 0 | 0 | 0 | 0 | 186 | |||||||||||||||||||||||||||||||||||||||||||||||||||||||||||||||||||
| By treatment/disposal and material (2008*)3 | |||||||||||||||||||||||||||||||||||||||||||||||||||||||||||||||||||||||||||||||
| Total | 10 858 | 1 188 | 1 134 | 507 | 281 | 1 664 | 130 | 1 778 | 804 | 404 | 1 845 | 1 123 | |||||||||||||||||||||||||||||||||||||||||||||||||||||||||||||||||||
| Sorted for material recovery | 3 388 | 676 | 1 033 | 71 | 109 | 414 | 12 | 539 | 100 | 102 | 279 | 52 | |||||||||||||||||||||||||||||||||||||||||||||||||||||||||||||||||||
| Biological treatment | 455 | 0 | 0 | 0 | 0 | 152 | 0 | 235 | 0 | 69 | 0 | 0 | |||||||||||||||||||||||||||||||||||||||||||||||||||||||||||||||||||
| Energy recovery | 2 056 | 177 | 0 | 146 | 0 | 828 | 44 | 420 | 0 | 122 | 206 | 112 | |||||||||||||||||||||||||||||||||||||||||||||||||||||||||||||||||||
| Filling compound and cover material | 530 | 7 | 0 | 0 | 412 | 15 | 0 | 26 | 444 | 14 | 411 | 0 | |||||||||||||||||||||||||||||||||||||||||||||||||||||||||||||||||||
| Incineration without energy recovery | 464 | 52 | 439 | 41 | 450 | 73 | 13 | 126 | 0 | 0 | 24 | 46 | |||||||||||||||||||||||||||||||||||||||||||||||||||||||||||||||||||
| Landfill | 2 123 | 189 | 37 | 156 | 110 | 182 | 52 | 191 | 240 | 39 | 247 | 679 | |||||||||||||||||||||||||||||||||||||||||||||||||||||||||||||||||||
| Other final treatment | 234 | 0 | 0 | 0 | 0 | 0 | 0 | 0 | 0 | 0 | 0 | 234 | |||||||||||||||||||||||||||||||||||||||||||||||||||||||||||||||||||
| Other or unspecified | 1 608 | 86 | 25 | 93 | 0 | 0 | 7 | 241 | 419 | 58 | 677 | 0 | |||||||||||||||||||||||||||||||||||||||||||||||||||||||||||||||||||
| 1 | The waste amount from ships and big constructions, as oil platforms, are counted as the average for the whole period from 1995 to 2009. |
| 2 | Includes scrapped cars and motor bikes, and paper burnt at home. |
| 3 | Exported waste is categorised according to the treatment or disposal it undergoes in the destination country, insofar this treatment or disposal method is known. Exported waste for which the treatment or disposal method is unknown, is categorised as unknown or unspecified. Imported waste is not covered by the statistics. |
| 4 | The figure was corrected 27 October 2010 at 14:15 p.m. |
More figures are available in StatBank:http://statbank.ssb.no/statistikkbanken/default_fr.asp?PLanguage=1 Related articles: - Household waste http://www.ssb.no/english/subjects/01/05/10/avfkomm_en/ - Waste from manufacturing industries http://www.ssb.no/english/subjects/01/05/20/avfind_en/ - Building and construction waste http://www.ssb.no/english/subjects/01/05/avfbygganl_en/ - Waste from service industries http://www.ssb.no/english/subjects/01/05/20/avfhandel_en/ - Waste treatment http://www.ssb.no/english/subjects/01/05/avfhand_en/ - Hazardous waste http://www.ssb.no/english/subjects/01/05/30/spesavf_en/ |
Contact
-
Camilla Skjerpen
E-mail: camilla.skjerpen@ssb.no
tel.: (+47) 48 22 72 14


