Content
Published:
This is an archived release.
Reduced growth in waste amounts for 2008
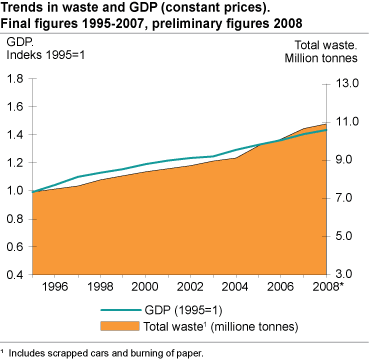
Norwegian industries and households generated 10.9 tonnes of waste in 2008, up 2 per cent from the previous year. The waste amounts had a slower growth in 2008 than the year before, when the growth reached 6 per cent. A total of 71 per cent of the waste being handled in known ways was recovered, excluding hazardous waste.
These are results from Statistics Norway’s new estimations on waste generation and handling in industries and households. The figures for 2008 are preliminary, and hence have a somewhat higher uncertainty than final figures.
The total growth in waste amounts since 1995 was 48 per cent, which is slightly higher than the growth in GDP (fixed prices) of 44 per cent in the same period. A Norwegian national target set by the authorities has been to bring the growth in waste amounts to a level that is considerably lower than the economic growth, expressed by GDP.
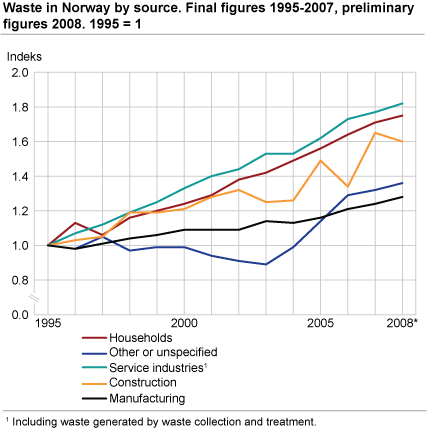
The waste amounts from households increased by 75 per cent from 1995 to 2008, substantially exceeding the growth in total waste amounts in terms of per cent. The industrial waste showed a slightly lower growth in the same period, by 43 per cent.
Large rise in waste from service production
The service industries generated 1.8 million tonnes of waste in 2008, comprising 16 per cent of the total national amounts. This includes waste arising from waste handling. The growth since 1995 is estimated as high as 82 per cent. Just above half the waste was delivered as mixed waste.
The manufacturing industries generated about 4 million tonnes of waste in 2008, according to our preliminary figures, which makes up 37 per cent of the national waste total. About ¾ of the waste stemmed from production processes.
Waste from construction and demolition industries amounted to 1.5 million tonnes in 2008, excluding clean soils and rocks. The trend after 2004 is somewhat uncertain, but is believed to be as shown in figure 2 based on the annual amount of constructed area.
Slight increase in recovery rate
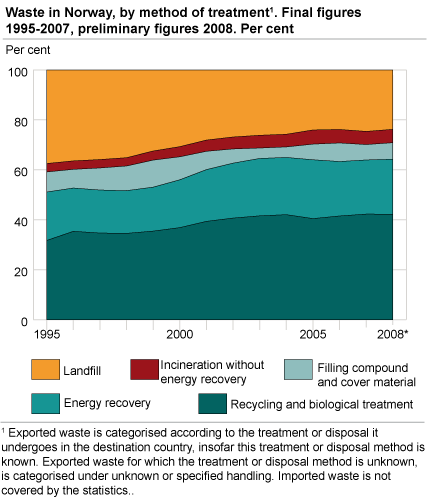
The recovery rate reached 71 per cent in 2008, from a steady level around 70 per cent since 2004. Recycling comprised 3.4 million tonnes, or just above 37 per cent, while energy recovery counted for 22 per cent. The remaining 11 per cent was recovered either by biological treatment (e.g. composting) or by use as filling compound or cover material at landfills. Recycling and biological treatment are the fastest growing recovery forms since 1995. Hazardous waste and waste handled in other or unknown ways are excluded from the estimation of recovery rates. The recovery of metals amounted to 1.0 million tonnes, giving a recovery rate of 93 per cent. The recovery rate for paper reached 78 per cent, and was dominated by recycling.
Landfilling of waste amounted to 2.1 million tonnes in 2008, after a slight decrease from the previous year. Hazardous waste (slag and ash containing heavy metals, heavily polluted matter, acidic sludge, etc.) disposed of at specially engineered landfills was by far the biggest portion, making up slightly more than one third of the landfilled amounts. According to our estimations, about a quarter consisted of organic, putrescible materials that decompose to methane inside the landfills. The split of landfilled waste by material is somewhat uncertain due to the limited data basis.
The breakdown of treatment and disposal methods has been revised since the previous release.
Large rise in food and slaughterhouse waste continues
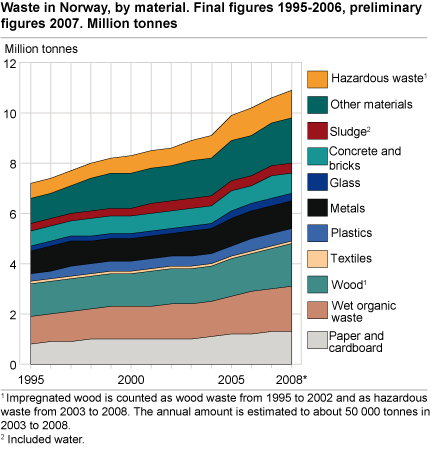
Wet-organic waste was the largest material portion in 2008, with 1.8 million tonnes. Food waste from industries and households made up 55 per cent of this, while production waste from slaughterhouses, other manufacturing industries, fishery and farming comprised 39 per cent. The remainder was park and garden waste. The amount of wet-organic waste climbed 4 per cent from the previous year and 65 per cent from 1995. However, the landfilled amount fell by 39 per cent from 1995 to 2008.
The hazardous waste amount showed an increase from 1995 by 72 per cent, but incomplete registering of hazardous waste in the beginning of the period may be an important reason. The decrease in the amount of hazardous waste in 2008 is regarded to be somewhat uncertain. The amount of paper waste seems to have had a slight decline of 4 per cent in 2008.
| Total1 |
Paper,
cardboard and pasteboard |
Metals | Plastics | Glas |
Wood
waste |
Textiles |
Wet
organic waste |
Concrete
and bricks |
Sludge | Other |
Hazardous
waste |
||||||||||||||||||||||||||||
|---|---|---|---|---|---|---|---|---|---|---|---|---|---|---|---|---|---|---|---|---|---|---|---|---|---|---|---|---|---|---|---|---|---|---|---|---|---|---|---|
| 1995 | 7 336 | 844 | 919 | 327 | 189 | 1 328 | 109 | 1 096 | 591 | 325 | 978 | 630 | |||||||||||||||||||||||||||
| 1996 | 7 500 | 937 | 956 | 349 | 179 | 1 327 | 113 | 1 129 | 615 | 320 | 955 | 620 | |||||||||||||||||||||||||||
| 1997 | 7 659 | 929 | 959 | 360 | 182 | 1 300 | 115 | 1 156 | 634 | 325 | 1 089 | 611 | |||||||||||||||||||||||||||
| 1998 | 7 992 | 961 | 945 | 366 | 189 | 1 301 | 116 | 1 208 | 727 | 324 | 1 254 | 601 | |||||||||||||||||||||||||||
| 1999 | 8 193 | 990 | 934 | 374 | 194 | 1 263 | 115 | 1 276 | 743 | 330 | 1 383 | 591 | |||||||||||||||||||||||||||
| 2000 | 8 419 | 1 046 | 936 | 380 | 200 | 1 311 | 113 | 1 306 | 720 | 340 | 1 394 | 672 | |||||||||||||||||||||||||||
| 2001 | 8 571 | 1 037 | 940 | 388 | 211 | 1 367 | 112 | 1 343 | 747 | 352 | 1 424 | 651 | |||||||||||||||||||||||||||
| 2002 | 8 739 | 1 034 | 935 | 400 | 225 | 1 420 | 111 | 1 407 | 743 | 366 | 1 441 | 657 | |||||||||||||||||||||||||||
| 2003 | 8 956 | 1 023 | 953 | 414 | 242 | 1 438 | 111 | 1 381 | 688 | 377 | 1 517 | 814 | |||||||||||||||||||||||||||
| 2004 | 9 116 | 1 084 | 994 | 426 | 242 | 1 381 | 113 | 1 446 | 668 | 379 | 1 488 | 894 | |||||||||||||||||||||||||||
| 2005 | 9 762 | 1 173 | 1 054 | 437 | 264 | 1 474 | 116 | 1 523 | 781 | 403 | 1 574 | 963 | |||||||||||||||||||||||||||
| 2006 | 10 121 | 1 233 | 1 097 | 467 | 265 | 1 462 | 118 | 1 657 | 714 | 374 | 1 628 | 1 105 | |||||||||||||||||||||||||||
| 2007 | 10 683 | 1 306 | 1 110 | 492 | 289 | 1 589 | 124 | 1 749 | 863 | 383 | 1 743 | 1 034 | |||||||||||||||||||||||||||
| 2008* | 10 900 | 1 300 | 1 100 | 510 | 300 | 1 700 | 130 | 1 800 | 840 | 400 | 1 800 | 1 080 | |||||||||||||||||||||||||||
| By source and material (2007) | |||||||||||||||||||||||||||||||||||||||
| Total | 10 683 | 1 306 | 1 110 | 492 | 289 | 1 589 | 124 | 1 749 | 863 | 383 | 1 743 | 1 034 | |||||||||||||||||||||||||||
| Households2 | 2 138 | 499 | 233 | 151 | 78 | 363 | 52 | 548 | 3 | - | 189 | 22 | |||||||||||||||||||||||||||
| Agriculture, forestry and fishing | 152 | 6 | 11 | 12 | - | - | 4 | 115 | - | - | - | 1 | |||||||||||||||||||||||||||
| Mining and quarrying | 208 | 10 | 24 | 4 | - | 11 | - | 8 | 8 | - | 9 | 132 | |||||||||||||||||||||||||||
| Manufacturing | 3 883 | 198 | 214 | 69 | 47 | 730 | 12 | 671 | 127 | 283 | 1 027 | 505 | |||||||||||||||||||||||||||
| Electricity, gas and water supply | 43 | 2 | 4 | - | - | 2 | - | - | 1 | - | 1 | 31 | |||||||||||||||||||||||||||
| Construction | 1 537 | 19 | 64 | 15 | 85 | 240 | - | - | 720 | - | 351 | 10 | |||||||||||||||||||||||||||
| Service industries | 1 753 | 456 | 127 | 148 | 51 | 201 | - | 376 | 4 | 101 | 164 | 83 | |||||||||||||||||||||||||||
| Other or unspecified | 968 | 116 | 434 | 92 | 27 | 41 | 8 | - | - | - | 0 | 251 | |||||||||||||||||||||||||||
| By treatment/disposal and material (2007)3 | |||||||||||||||||||||||||||||||||||||||
| Total | 10 683 | 1 306 | 1 110 | 492 | 289 | 1 589 | 124 | 1 749 | 863 | 383 | 1 743 | 1 034 | |||||||||||||||||||||||||||
| Material recovery | 3 312 | 683 | 1 035 | 70 | 119 | 376 | 13 | 506 | 100 | 100 | 273 | 37 | |||||||||||||||||||||||||||
| Biological treatment | 440 | - | - | - | - | 147 | - | 228 | - | 66 | 0 | - | |||||||||||||||||||||||||||
| Energy recovery | 1 968 | 176 | - | 146 | - | 805 | 45 | 418 | - | 116 | 200 | 63 | |||||||||||||||||||||||||||
| Filling compound and cover material | 542 | 6 | - | 0 | - | 20 | 0 | 17 | - | 11 | 361 | 0 | |||||||||||||||||||||||||||
| Incineration without energy recovery | 463 | 57 | - | 46 | - | 79 | 15 | 139 | - | - | 25 | 11 | |||||||||||||||||||||||||||
| Landfill | 2 175 | 176 | 34 | 142 | 109 | 163 | 47 | 184 | 243 | 37 | 293 | 746 | |||||||||||||||||||||||||||
| Other final treatment | 178 | - | - | - | - | - | - | - | - | - | 0 | 178 | |||||||||||||||||||||||||||
| Other or unspecified | 1 605 | 207 | 0 | 88 | 0 | 0 | 5 | 258 | 403 | 54 | 591 | 0 | |||||||||||||||||||||||||||
| 1 | The waste amount from ships and big constructions, as oil platforms, are counted as the average for the whole period from 1995 to 2007. |
| 2 | Includes scrapped cars and paper burnt at home. |
| 3 |
Exported waste is categorised according to the treatment or disposal it undergoes in the destination country, insofar this treatment or disposal
method is known. Exported waste for which the treatment or disposal method is unknown, is categorised as unknown or unspecified. Imported waste is not covered by the statistics. |
For more figures, go to StatBank Norway:http://statbank.ssb.no/statistikkbanken/default_fr.asp?PLanguage=1 Related articles: - Household waste http://www.ssb.no/english/subjects/01/05/10/avfkomm_en/ - Waste from manufacturing industries http://www.ssb.no/english/subjects/01/05/20/avfind_en/ - Building and construction waste http://www.ssb.no/english/subjects/01/05/avfbygganl_en/ - Waste from service industries http://www.ssb.no/english/subjects/01/05/20/avfhandel_en/ - Waste treatment http://www.ssb.no/english/subjects/01/05/avfhand_en/ - Hazardous waste http://www.ssb.no/english/subjects/01/05/30/spesavf_en/ |
Contact
-
Camilla Skjerpen
E-mail: camilla.skjerpen@ssb.no
tel.: (+47) 48 22 72 14


