Content
Published:
This is an archived release.
Continued waste growth in 2006
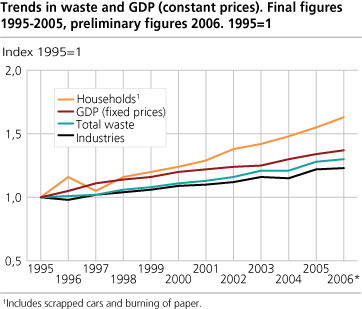
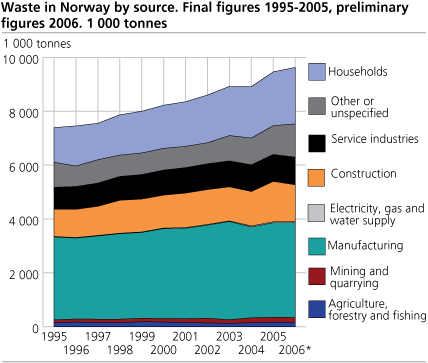
During the last eleven years, the amount of waste has increased by 30 per cent to 9.6 million tonnes. In comparison, the GDP has increased by 37 per cent. The amount of waste levelled out somewhat in 2006.
In 2006, the amount of waste was 9.6 million tonnes. Since 1995 the amount of waste has increased by 200 000 tonnes per year on average, or 30 per cent. In comparison, the GDP has increased by 37 per cent in the same period. Preliminary figures for 2006 show an increase in waste of 170 000 from 2005, which indicates that the waste amounts could be levelling out.
Sharp growth in household waste
Although the total amount of waste has risen less than the GDP since 1995, this is not the case for household waste. The amount of household waste has risen by 63 per cent, exceeding the growth in private consumption of 51 per cent. One possible explanation for the disproportionate growth in household waste could be a substantial increase in imports of consumption goods, which means that the waste from production is generated abroad. Private households account for 22 per cent of the total waste (including scrapped cars).
In comparison, the manufacturing industries account for 37 per cent of the total waste, of which 90 per cent is production waste. Waste from manufacturing has declined by 3 per cent since 2003.
Getting closer to national target
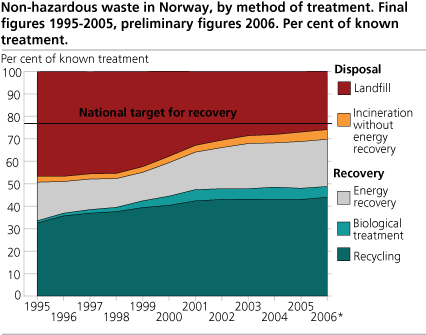
Close to 70 per cent of the waste which was treated in known ways was recovered in 2006 (excluding hazardous waste). About two thirds went to recycling, while the remaining went to energy recovery or composting. The national target is to increase this figure to 75 per cent by 2010 and to 80 per cent if this is economically and environmentally justifiable.
Recovery has increased by 69 per cent since 1995, while the amount going to landfills has declined by 31 per cent. In 2006, about one quarter of the waste going to landfills was biodegradable, compared to one third in 1995.
We throw more plastic and paper
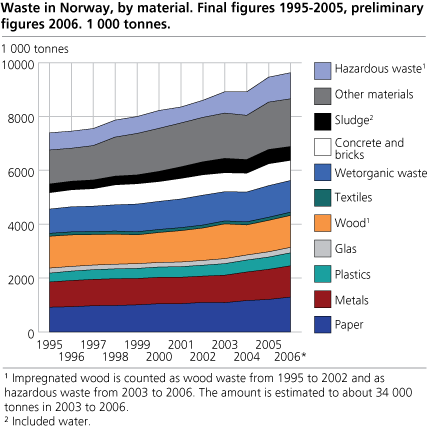
In 2006, 1.3 million tonnes of paper and 0.5 million tonnes of plastic were discarded, an increase of 7 and 6 per cent respectively from the previous year and 41 and 47 per cent from 1995. The plastic and paper go into recovery, leaving the amount for disposal almost constant during the period.
For more figures, go to StatBank Norway .
Related articles:
- Waste from manufacturing industries
- Building and construction waste
- Waste from service industries
Statistical magazine:
- Methane emissions from landfills
Tables:
Contact
-
Camilla Skjerpen
E-mail: camilla.skjerpen@ssb.no
tel.: (+47) 48 22 72 14


