Content
Published:
This is an archived release.
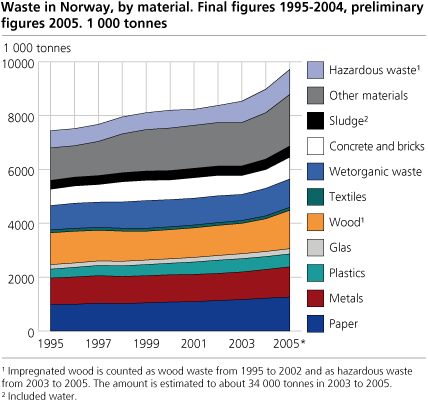
Nearly ten million tonnes of waste in 2005
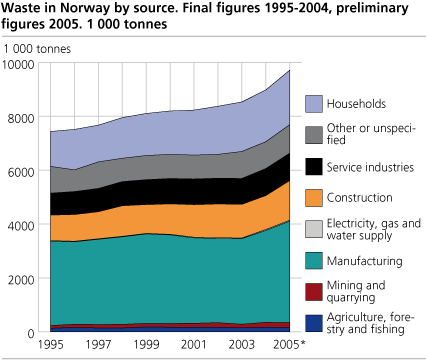
Norwegians discard increasingly more waste. In 2005, the amount reached 9.7 million tonnes, compared to 7.4 tonnes in 1995. Waste from households showed the fastest increase, while waste from manufacturing industries has risen significantly during the last two years.
The waste accounts compile all waste statistics from Statistics Norway, and combine with separate calculations. Preliminary figures bases on waste statistics and projections of several waste types to GDP.
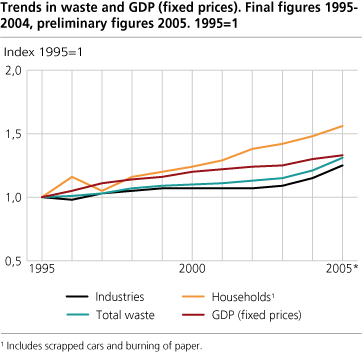
Waste amounts rise in step with the economy
Since 1995, the annual waste amounts have grown by 31 per cent. For comparison, GDP (constant prices) grew by 33 per cent in the same period. The Norwegian environmental authorities has decided as a national target that the annual waste amounts shall rise considerably less than the economy (expressed as GDP), and that about 75 per cent of the waste shall be recovered in 2010.
Significant increase in waste from manufacturing
The manufacturing industries handed in 3.8 million tonnes of waste in 2005 (including hazardous waste), according to our preliminary figures. This is a 0.6 million tonnes, or 18 per cent, increase from 2003.
The building and construction industry has shown a considerable waste increase as well, by 18 per cent during the last two years to 1.5 million tonnes in 2005. Concrete and bricks are dominating this increase.
Household waste amounts are increasing steadily, and slightly faster than the economy (GDP, constant prices). The 2005 waste amounts were 56 per cent higher than the amounts in 1995, and consumer products are showing the highest increase.
Steady increase in recovery
4.7 million tonnes of waste were sent for recovery in 2005. 62 per cent was recycled, while 31 per cent were energy recovered. The remaining was composed. The amount sent for recovery increased by 51 per cent in 2005 compared to 1995. In the same period, the amount sent for disposal dropped by 5 per cent, due to a 13 per cent decline in amounts being sent to landfills.
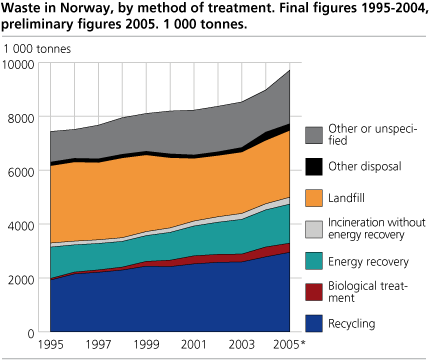
In 2005, 7.7 million tonnes of waste were treated as approved. The recovery share for non-hazardous waste was 69 per cent, while 39 per cent were disposed of. Only 7 per cent of the hazardous waste was sent for recovery, so that the all over recovery share was 61 per cent.
Evaluation of the figures
The figures in this article build on figures for similar waste types and industries in other articles from Statistics Norway. There are, however, some deviations as the figures in this article include some waste fractions not included in the more detailed articles, for instance end-of-life vehicles (households) and hazardous waste (manufacturing industries 2004). More over, this article emphasize preliminary figures for 2005, while some of the detailed articles present amounts in 2004.
When updating the waste accounts, all figures back to 1995 are revised. Historical waste amounts may therefore depart from previously released figures. The main updates related to this release, is a new survey of waste from manufacturing, revised micro data on metal wastes and new figures on hazardous waste.
Visit "About the statistics" for more information about data quality.
For more figures, visit StatBank Norway .
Please read our articles on:
- Waste from manufacturing industries
- Building and construction waste
- Waste from service industries
And our magazine article on methane emissions from landfills .
Tables:
Contact
-
Camilla Skjerpen
E-mail: camilla.skjerpen@ssb.no
tel.: (+47) 48 22 72 14