Content
Published:
This is an archived release.
8.5 million tonnes of waste
In the year 2000, Norway generated 8.5 million tones of waste, which is a million tones more than in 1995, and almost 2 tonnes per person. Around 40 per cent was recovered.
For the first time, Statistics Norway is able to present a complete set of waste accounts for Norway. Earlier, separate material accounts have been presented.
More and more waste
8.5 million tonnes of waste was generated in Norway in 2000. Waste from fishing and harvesting which is sent directly back into natural cycles, is not included in the figures. Dismantled ships and off-shore installations are also excluded.
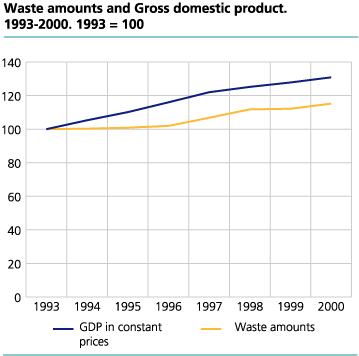
Annual waste generation has increased every year since 1993. This is the case also for most of the material fractions. For wood, glass and hazardous waste, the trend has been negative or uneven. For the others, there is a clearly positive trend.
40 per cent recovery
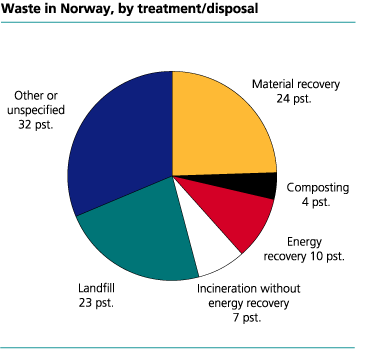
Around 3.5 million tonnes, or nearly 40 per cent, was recovered by means of material recovery, energy recovery or composting. Although the recovery percentage has increased since 1993, it remained more or less the same in 2000 as in 1999. Material and energy recovery of hazardous waste is not included in these figures.
Less construction and demolition waste than formerly believed
Earlier, Statistics Norway has calculated the amounts of construction and demolition (C&D) waste to be around 15 million tones per year. Those calculations are now revised, and the new calculations show that in the year 2000, 940 000 tonnes of C&D waste arose.
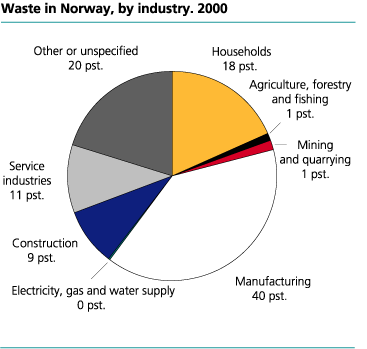
60 per cent from manufacturing and households
40 per cent of the waste comes from the manufacturing industries. Unpolluted stone, gravel, sand etc. is then excluded. However, the manufacturing industries hardly generated more waste in 2000 than in 1993. The growth in annual waste generation hence occurs elsewhere than in the manufacturing industries, e.g. in the households. Household waste, which constituted 18 per cent of total waste in 2000, increased by more than 43 per cent from 1992 to 2000. Please be aware that waste from construction industries does not equal the amount of C&D waste. For instance, C&D waste arises whenever a building is built, demolished or rehabilitated, no matter who does the work and delivers the waste. Conversely, the construction industries have other waste than C&D waste, e.g. ordinary consumer waste from administration of enterprises.
Please be aware also that the figures for metal and "Other materials" are very uncertain.
Tables:
Contact
-
Camilla Skjerpen
E-mail: camilla.skjerpen@ssb.no
tel.: (+47) 48 22 72 14


