Content
Published:
This is an archived release.
More waste, less recovery
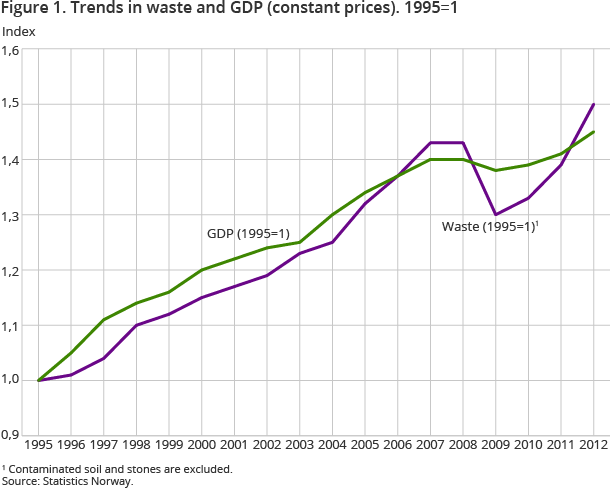
The total waste amount for Norway increased by 8 per cent from 2011 to 2012. In 2012, a total of 10.7 million tonnes of waste was generated. While the waste amount is increasing, the fraction that is recovered is decreasing.
| 2012 | ||
|---|---|---|
| 1000 tonnes | Share | |
| Source of origin, total | 10 663 | 100 |
| Manufacturing industries | 2 638 | 25 |
| Construction | 1 884 | 18 |
| Service industries | 1 958 | 18 |
| Households | 2 476 | 23 |


Waste amounts have been steadily increasing over the last few years, and the numbers are now at an all time high. Waste amounts have increased by 8 per cent since 2011. At the same time, the value added measured by GDP (constant prices) has increased by only 3 per cent in the last year.
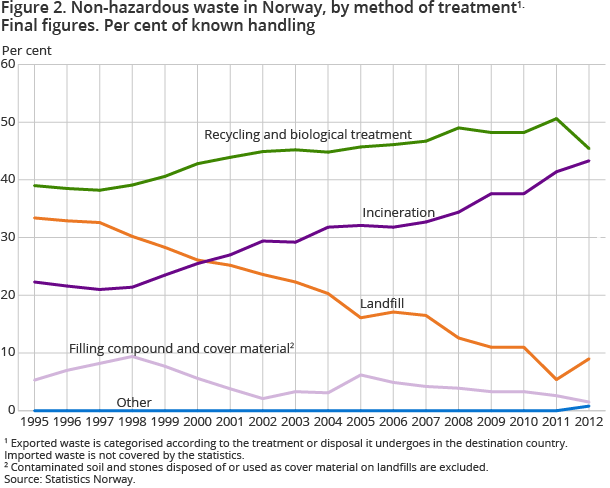
More waste is incinerated, less is material recovered
As the amount of waste is increasing, the amount of waste that is sent for incineration is also increasing. In 2012, 34 per cent of non-hazardous waste undergoing known treatment was energy recovered , while 39 per cent was subject to material recovery. The total recovery of non-hazardous waste undergoing known treatment was 81 per cent in 2012; a decrease from 87 per cent in 2011.
The increase in incineration is partly due to the low prices and increased incineration capacity in Norway and Sweden in recent years. Mixed waste and wood waste are the largest fractions that are incinerated.
The amount of waste going to landfill has also increased in 2012. In 2012, around 9 per cent of non-hazardous waste undergoing known treatment was deposited. The increase in deposited waste is partly due to increased amounts of secondary waste from waste incineration.
Mostly mixed waste
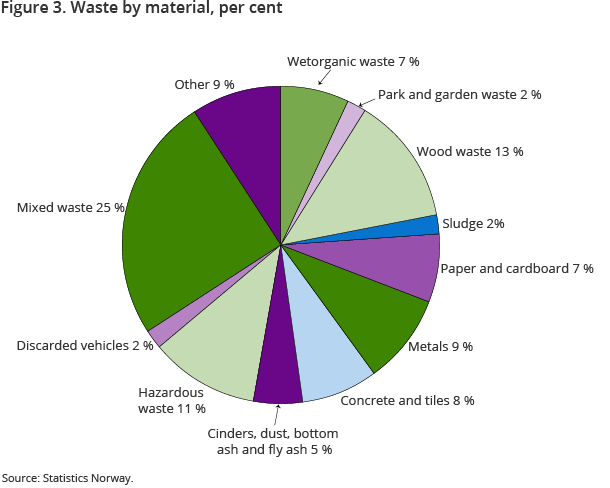
The material types with most waste in 2012 were the newly created category mixed waste, which had 25 per cent of the total, followed by wood waste with 13 per cent and hazardous waste with 11 per cent.
Households’ share of waste is increasing
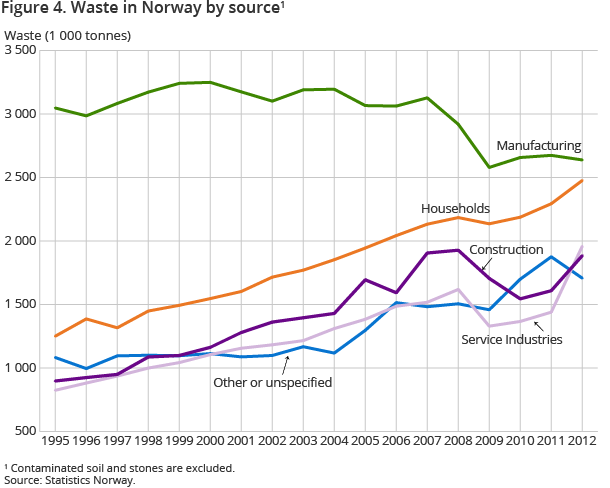
The manufacturing industry is still the source of the largest amount of waste, with 2.6 million tonnes in 2012, followed by households and the service industries. However, while the waste from the manufacturing industry has been fairly stable in recent years, the waste from most other sectors is increasing. Households are now responsible for generating 23 per cent of waste amounts, and the service industries for 18 per cent. The service sector increased the most from 2011 to 2012.
Masses for landfilling and cover materials
While ordinary waste sent for landfill has increased in the last year, the amounts of slightly polluted soil that are deposited have decreased. In 2012, 1.3 million tonnes were sent to ordinary landfills and 0.4 million tonnes were used as cover material. This is a decrease compared to 2011, where a total of 2.2 million tonnes was deposited or used as cover materials.
Changes in the waste account: Methodology and categoriesOpen and readClose
Prior to publication of figures for 2012, the waste account was subject to major changes in both methodology and published categories. Mixed waste is one of the categories. This means that large amounts of wet organic waste, paper and plastics, which were previously published in their own category, are now also part of mixed waste. More details of this change are available in About the statistics.
Changes makes comparison difficultOpen and readClose
Since the change prior to the 2012 publication, the waste amounts have been even more based on measured figures. For instance, the figures from the manufacturing industry are now calculated based on figures from the industry’s own reporting to the government in addition to figures from Statistics Norway for the manufacturing industry for 2008. The fact that the statistics are published with more and different material categories than before also makes it difficult to compare amounts of waste per material with earlier years.
Contact
-
Camilla Skjerpen
E-mail: camilla.skjerpen@ssb.no
tel.: (+47) 48 22 72 14
