Content
Published:
This is an archived release.
Norwegians are producing more waste than ever
I 2005 every Norwegian generated an average 407 kilos of household waste, about 29 kilos more than the year before. In total, 1.8 million tonnes of household waste was collected in 2005, of which 49 per cent was sorted and sent to recovery plants.
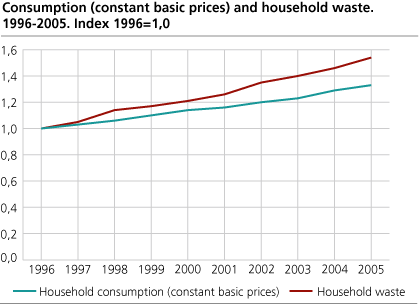
The figures show that household waste generation increased by 5.6 per cent from 2004 to 2005. This is more than the increase in household consumption, measured in NOK. The figures do not include discarded vehicles and other waste not covered by the municipal waste collection services.
|
Household waste. Total amount and
recovery. 1992-2005. Tonnes and kg per inhabitant |
| Total | Sent for recovery | ||||||||||||||||||||||||||||||||||||||
|---|---|---|---|---|---|---|---|---|---|---|---|---|---|---|---|---|---|---|---|---|---|---|---|---|---|---|---|---|---|---|---|---|---|---|---|---|---|---|---|
| Total |
Kg per
inhabitant |
Total |
Kg per
inhabitant |
||||||||||||||||||||||||||||||||||||
| 19921 | 1 012 192 | 237 | 86 363 | 20 | |||||||||||||||||||||||||||||||||||
| 19951 | 1 173 643 | 269 | 212 689 | 49 | |||||||||||||||||||||||||||||||||||
| 19961 | 1 195 274 | 274 | 260 234 | 60 | |||||||||||||||||||||||||||||||||||
| 19971 | 1 259 333 | 287 | 365 898 | 83 | |||||||||||||||||||||||||||||||||||
| 1998 | 1 363 909 | 309 | 452 698 | 102 | |||||||||||||||||||||||||||||||||||
| 1999 | 1 396 674 | 314 | 524 156 | 118 | |||||||||||||||||||||||||||||||||||
| 2000 | 1 451 590 | 324 | 581 056 | 130 | |||||||||||||||||||||||||||||||||||
| 2001 | 1 506 715 | 335 | 668 393 | 148 | |||||||||||||||||||||||||||||||||||
| 2002 | 1 612 674 | 354 | 731 632 | 161 | |||||||||||||||||||||||||||||||||||
| 2003 | 1 670 602 | 365 | 764 347 | 167 | |||||||||||||||||||||||||||||||||||
| 2004 | 1 746 353 | 378 | 854 338 | 185 | |||||||||||||||||||||||||||||||||||
| 2005 | 1 843 575 | 407 | 905 799 | 202 | |||||||||||||||||||||||||||||||||||
| 1 |
The figures are scaled down to correct for
interference of waste from the industries. |
More waste is sorted
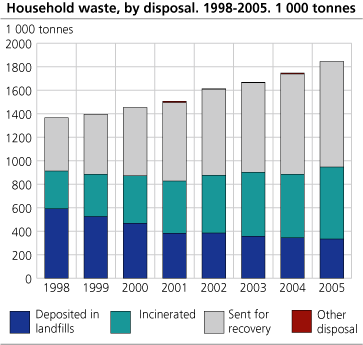
A total of 906 000 tonnes of household waste was sorted and sent to recovery in 2005. This is a 6 per cent increase compared with 2004. On average every Norwegian sorted 202 kilos of waste in 2005 compared to 185 kilos in 2004.
In this context, sorted and sent to recovery means that the waste is pre-sorted in the household or at waste disposal plants. After sorting, the waste is normally recycled, composted or incinerated for energy utilisation, but residues from sorting are in most cases disposed of in landfills.
Less goes to final disposal
The amount of household waste that goes to final disposal has fallen by 3 per cent compared to 2004. Around 333 000 tonnes of household waste was sent to landfills. In 2005, around 732 000 tonnes of household waste was incinerated, an increase of 14 per cent since 2004.
The figures are compiled from a census conducted by Statistics Norway in all Norwegian municipalities and inter-municipal waste management companies (excluding Svalbard).
or go to:
Statistics Norway, Waste statistics
Statistics Norway, Waste accounts
Tables:
- Table 1 Household waste. Percentage waste sent for recovery, including energy recovery, by county and municipality. 1995-2004 (Corrected 21 June 2006 at 1445)
- Table 2 Household waste sent for recovery, by material and county. 1992-2005. Tonnes
- Table 3 Household waste, by disposal and county. 1998-2005. 1 000 tonnes
- Table 4 Percentage of inhabitants living in municipalities offering collection at home of sorted waste fractions. 2002-2005 (Corrected 22 June 2006 at 1100)
Contact
-
Camilla Skjerpen
E-mail: camilla.skjerpen@ssb.no
tel.: (+47) 48 22 72 14
-
Mona E. Onstad
E-mail: mona.onstad@ssb.no
tel.: (+47) 48 59 61 86