Content
Published:
This is an archived release.
One kilo of waste
... per person every day in 2003. This is 11 kilos more than in 2002. The amount of household waste increased by 4 per cent from 2002 to 2003.
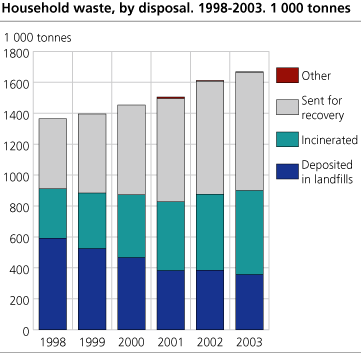
In total, 1.67 million tonnes of household waste was collected in 2003, 58 000 tonnes, or 3.6 per cent, more than in the previous year. 46 per cent went to recovery, compared with 45 per cent in the previous year.
The amount of waste is increasing even more
| Household waste. 1992-2003. Tonnes and kilo per inhabitant |
| Total | Sent for recovery | ||||||||||||||||||||||||||||||||||||||
|---|---|---|---|---|---|---|---|---|---|---|---|---|---|---|---|---|---|---|---|---|---|---|---|---|---|---|---|---|---|---|---|---|---|---|---|---|---|---|---|
| The whole country | Total | Kilo per inhabitant | Total | Kilo per inhabitant | |||||||||||||||||||||||||||||||||||
| 19921 | 1 012 192 | 237 | 86 363 | 20 | |||||||||||||||||||||||||||||||||||
| 19951 | 1 173 643 | 269 | 212 689 | 49 | |||||||||||||||||||||||||||||||||||
| 19961 | 1 195 274 | 274 | 260 234 | 60 | |||||||||||||||||||||||||||||||||||
| 19971 | 1 259 333 | 287 | 365 898 | 83 | |||||||||||||||||||||||||||||||||||
| 1998 | 1 363 909 | 309 | 452 698 | 102 | |||||||||||||||||||||||||||||||||||
| 1999 | 1 396 674 | 314 | 524 156 | 118 | |||||||||||||||||||||||||||||||||||
| 2000 | 1 451 590 | 324 | 581 056 | 130 | |||||||||||||||||||||||||||||||||||
| 2001 | 1 506 715 | 335 | 668 393 | 148 | |||||||||||||||||||||||||||||||||||
| 2002 | 1 612 674 | 354 | 731 632 | 161 | |||||||||||||||||||||||||||||||||||
| 2003 | 1 670 602 | 365 | 764 347 | 167 | |||||||||||||||||||||||||||||||||||
| 1 | The figures are scaled down to correct for interference of waste from the industries. |
| Source: Avfallstatistikk, Statistisk sentralbyrå. | |
Last year each Norwegian delivered on average 365 kilos of household waste, which is 11 kilos more than in 2002.
and less increase in sorting
A total of 764 000 tonnes of household waste, or 46 per cent, were sorted for recovery in 2003. This is an increase of just 1 percentage point from the year before. On average each Norwegian sorted 167 kilos of waste in 2003 compared to 161 kilos in 2002.
Here sorted for recovery means sorted at home or at waste disposal plants. After sorting, the waste is usually recycled, composted or incinerated for energy, but residues from sorting are in most places disposed of in landfills.
more waste was incinerated
After several years with decreasing amounts of waste sent to landfills, there was a small increase from 2002 to 2003 by 1856 tonnes. A total of about 357 000 tonnes was sent to landfills. While 58 per cent of all household waste in the most northern part of Norway was sent to landfills, nothing was reported sent to landfills in Oslo. In 2003 about 544 000 tonnes of household waste was incinerated, an increase of 10 per cent since 2002.
Better collection service
All municipalities in Norway now have a kind of recycling scheme. The most common material fractions for sorting at home are paper, which is collected in 382 out of 435 municipalities, and biodegradables, which is collected in 325 municipalities. Hazardous waste was collected at home or at receiving stations (bring/drop off-sites) in 401 municipalities in 2003.
356 out of 434 municipalities offered free delivering of one or more sorted material fractions at receiving stations. This arrangement was financed by the ordinary tax.
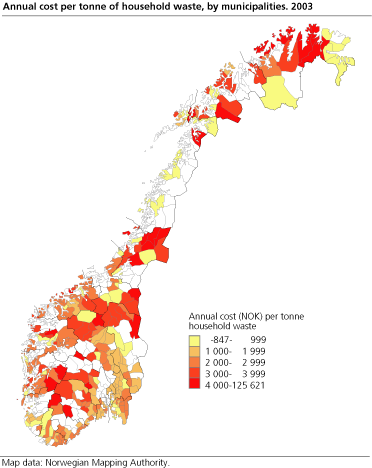
Although a majority of the Norwegian municipalities have outsourced their waste collection and disposal service, the municipalities themselves collect the waste collection fees in most cases. Collection and disposal of household waste cost the municipalities a total of 3 271 million NOK in 2003. 2 988 million NOK, or 91 per cent of the cost, were collected in fees. The average cost of collecting and disposing of a tonne of household waste in 2003 was hence 1 958 NOK. The map shows how this cost varies between the different Norwegian municipalities. In 2004 the average collection and disposal fee for Norwegian households is 1 774 NOK.
The figures are compiled from a census that Statistics Norway conducted in all municipalities and inter-municipal waste management companies in Norway where Svalbard was excluded.
Tables:
- Table 1 Houshold waste, by county and municipality. Per cent, waste sent for recovery, include energy recovery. 1995, 1998, 2001, 2002 and 2003
- Table 2 Household waste sent for recovery, by material and county. 2003. Tonnes,
- Table 3 Household waste, by disposal. 1992-2003. 1 000 tonnes,
- Table 4 Per cent inhabitants living in municipalities offering collection at home of sorted waste fractions. 2003
- Table 5 Investment, annual costs and fee income 2003. Fees 2004. Counties and Norway
Contact
-
Camilla Skjerpen
E-mail: camilla.skjerpen@ssb.no
tel.: (+47) 48 22 72 14
-
Mona E. Onstad
E-mail: mona.onstad@ssb.no
tel.: (+47) 48 59 61 86