Content
Published:
This is an archived release.
More for recovery than to landfills
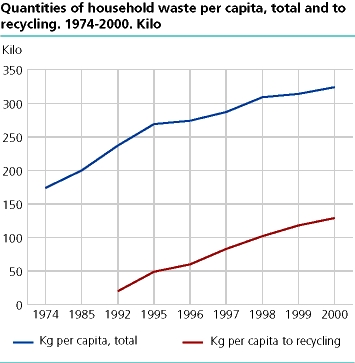
In 2000 Norwegian households and municipalities for the first time sorted more household waste for recovery than they sent to landfills. Each Norwegian sorted 130 kilos of waste for recovery, whereas 103 kilos were sent to landfills. But the amount of household waste is still increasing. In 2000, 1.5 million tonnes of household waste was collected.
Each Norwegian delivered 324 kilos of household waste in 2000. This is 10 kilos more than in 1999. In all, 1.5 million tons of household waste was collected, which is 55 000 tonnes more than the year before.
The amount of waste is increasing...
Increases in the amount of household waste have been registered ever since the first investigations were done at the beginning of the 1970s. In 1974 each person delivered on average 174 kilos of household waste.
The Survey of Consumer Expenditure (see http://www.ssb.no/english/subjects/05/02/fbu_en ) shows that Norwegian households' consumption has increased during the entire 1990s. Even though not all consumption automatically produces more waste, increases in living standards and consumption will lead to more waste. Some of the increase in the amount of waste may also be due to improvements in arrangements for collecting waste, so that more waste is being captured by the statistics. This last effect was probably more noticeable back in the 1970s and 1980s, when, for example, "home incineration" of waste was more common than in later years.
The waste policy objective of the environmental protection authorities is that the growth in the amount of waste should be substantially less than the growth of the economy. For example, we can use gross national product (GNP) to measure economic growth. We see then that from 1992 to 2000, household waste per person increased by 37 per cent, whereas GNP grew by 29 per cent. Thus, household waste is growing more.
...but sorting is growing more...
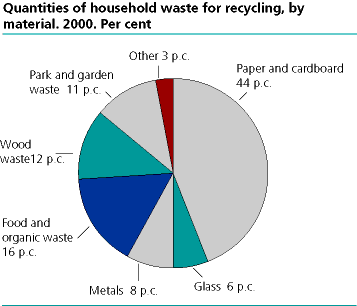
We are sorting more and more. Of the 1.5 million tons household waste collected last year, 581 000 tonnes were sorted for recovery. On average each Norwegian sorted 130 kilos of waste in 2000. This is 12 kilos more than in 1999, a larger increase than the increase in the total amount of household waste. The measures implemented by environmental protection authorities and municipalities to increase the sorting of waste have thus produced results. For most of the years in the 1990s the increase in the amount of household waste being sorted was greater than the total increase in the amount of household waste. This trend is continuing. Although the trend is continuing for all materials, in per cent it was plastic that increased the most. For metal, wood and park and gardening waste there was also an over 20 per cent increase from 1999 to 2000. For all materials the amount sorted in 2000 was the highest recorded.
Here sorted for recovery means the waste that each household sorts at home or that is sorted at waste disposal plants. After sorting, the waste may be subject to material recovery, incinerated for energy or used as landfill. After such treatment there may be residue that in most places is disposed of in landfills. Waste from waste treatment is considered industrial waste.
...so that less goes into landfills
Approximately 32 per cent of household waste is delivered directly to landfills. For 2000 this corresponds to 467 000 tonnes, or 104 kilos from every Norwegian. This is a decrease of 127 000 tonnes, or 22 per cent, from 1998. In 2000 about 406 000 tonnes of household waste was incinerated, an increase of 27 per cent since 1998. In 1999 the average energy utilisation at Norwegian waste incineration plants was 73 per cent. If energy utilisation remained the same in 2000, 297 000 tonnes of residual waste from households was utilised for energy in 2000. This means that 60 per cent of household waste is utilised and 40 per cent goes for final treatment. This is closer to the waste policy target of 25 per cent final treatment before 2010 than Norway was in 1998, when about half of household waste went to final treatment. These calculations do not take into account the fact that some of the sorted waste is rejected by the recovery process and ends up in landfills or incinerated. The true percentage going to final treatment is thus somewhat higher. One should also note that the target of 25 per cent final treatment applies to all waste, and not just household waste.
Industrial waste is being privatised
The statistics also include the share of industrial waste that is handled by municipal waste management schemes. The statistics show that more industrial waste was collected in the municipalities in the first years of the 1990s. After that there was less industrial waste in the municipal waste management system. From this one can hardly concluded that business and industry are generating less waste, but that many businesses are now using private waste disposal companies.
It is not only household waste that is being more diligently sorted. Sorting of industrial waste has also increased during the 1990s, with the apparent exceptions of 1997 and 1998. However the sampling plan and grossing-up methods were different in 1996 and 1997 from those used in 1999 and 2000. There is reason to take the figures for sorted industrial waste in 1996 and 1997 with a grain of salt.
In connection with collecting waste by waste collection vehicle or at receiving stations, it can be difficult to register private waste and industrial waste separately. It is also the case that municipalities have difficulty keeping track of the amount of waste generated in a particular municipality that is disposed of/delivered to municipal plants in surrounding municipalities or private companies. The figures are corrected for both these situations to a certain extent.
The figures are from a survey that Statistics Norway conducted in 50 municipalities and inter-municipal waste management companies. In all, 141 of the country's 435 municipalities and 54 per cent of the population were represented in the sample.
|
Quantities of houshold waste pr. capita, total and
delivered for material recovery. Tonnes and kg per capita |
| Total | recycling | ||||||||||||||||||||||||||||||||||||||
|---|---|---|---|---|---|---|---|---|---|---|---|---|---|---|---|---|---|---|---|---|---|---|---|---|---|---|---|---|---|---|---|---|---|---|---|---|---|---|---|
| Total | Kg per capita | Total | Kg per capita | ||||||||||||||||||||||||||||||||||||
| Whole country | |||||||||||||||||||||||||||||||||||||||
| 19921 | 1 012 192 | 237 | 86 363 | 20 | |||||||||||||||||||||||||||||||||||
| 19951 | 1 173 643 | 269 | 212 689 | 49 | |||||||||||||||||||||||||||||||||||
| 19961 | 1 195 274 | 274 | 260 234 | 60 | |||||||||||||||||||||||||||||||||||
| 19971 | 1 259 333 | 287 | 365 898 | 83 | |||||||||||||||||||||||||||||||||||
| 1998 | 1 363 909 | 309 | 452 698 | 102 | |||||||||||||||||||||||||||||||||||
| 1999 | 1 396 674 | 314 | 524 156 | 118 | |||||||||||||||||||||||||||||||||||
| 2000 | 1 451 590 | 324 | 581 056 | 130 | |||||||||||||||||||||||||||||||||||
| 1 |
The figures have been adjusted downwards to correct for intermixture
of waste from industrial sectors. |
Contact
-
Camilla Skjerpen
E-mail: camilla.skjerpen@ssb.no
tel.: (+47) 48 22 72 14
-
Mona E. Onstad
E-mail: mona.onstad@ssb.no
tel.: (+47) 48 59 61 86


