Content
Published:
This is an archived release.
1.3 million tonnes of waste from service activities
The service industries contributed with about 1.3 million tonnes of ordinary waste in 2006. This is 300 000 tonnes more than previous calculations for this year. About 40 per cent of the total amount of waste had its origin in wholesale and retail trade, auto repair shops and gas stations.
The amount of waste from the service industries constituted 14 per cent of all waste in Norway in 2006, and 18 per cent of the industrial waste. In comparison, 76 per cent of the Norwegian workforce was employed in the service industries this year. On average, each employee contributed with 819 kilos of waste. The waste was dominated by mixed waste and paper and cardboard waste.
Service IndustriesService Industries is a collective term including wholesale and retail trade, hotels and restaurants, transport, storage and communication, financial intermediation, real estate, renting and business activities, together with public and personal services. This corresponds to section G-Q in the Standard Industrial Classification (SIC2002) . For the time being the statistics cover section G-O, except 51.57- wholesale of waste and scrap, 60- land transport; transport via pipelines, 70- real estate activities, 90- sewage and refuse disposal, sanitation and similar activities |
Warehouses significant contributors
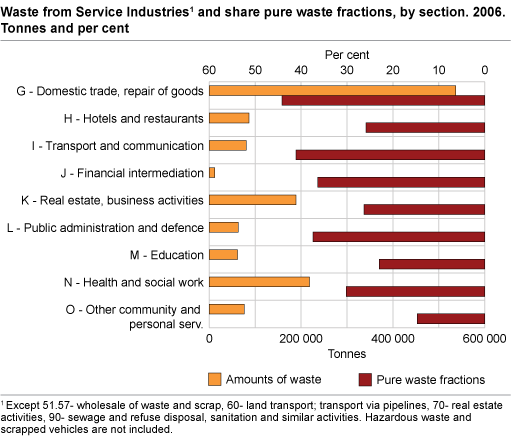
More than 500 000 tonnes or 40 per cent of the waste originated from wholesale and retail trade, repair of motor vehicles, motorcycles and personal and household goods. Typical establishments are food shops, clothing shops, repair shops, car dealers and gas stations.
Health- and social work services contributed with just above 16 per cent of the waste. More than half of the employees in this section work at hospitals, nursing homes or day care facilities. Establishments in renting and business activities contributed with 14 per cent of the waste.
The amount of waste varied with type of activity. This means that the amount of waste generated per employee may differ between sections. While each employee within wholesale and retail trade, repair of motor vehicles, motorcycles and personal and household goods was responsible for 1.5 tonnes of waste, employees in financial intermediation contributed with 274 kilos each.
Most mixed waste
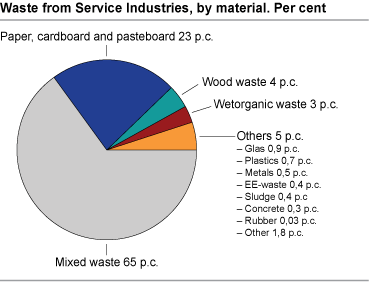
Most of the waste; 65 per cent, was collected as mixed waste. One should notice that mixed waste in this context is defined as waste that can not be classified as pure fractions. The share of mixed waste varied among the sections. Establishments in wholesale and retail trade, repair of motor vehicles and the like were best at pre-separation at source, with a pre-separation rate of 45 per cent. Establishments within other community, social- and personal service activities, such as hairdressers, beauty salons, interest groups and activities related to radio and television, pre-separated only 15 per cent of their waste at source.
Much paper- and cardboard waste
Apart from mixed waste, paper and cardboard was the most common waste type, constituting 23 per cent of the total waste. Paper and cardboard waste which is put in the mixed waste come in addition. Establishments in wholesale and retail trade, repair of motor vehicles and the like contributed with 55 per cent of the paper and cardboard waste. Of this, 75 per cent was pasteboard and corrugated cardboard, often called brown paper.
Three per cent of the waste was so-called wet organic waste. Of this, 80 per cent came from retail trade, hotels and the health section. Wet organic waste mainly contains food leftovers, but also paper towels and vegetative leftovers.
Uncertainty in the figuresThe calculations are based on customer registers from a selection of waste collectors. Some of the customers probably delivered a few pure waste fractions to waste collectors outside the selection, or to receivers outside the waste collection business. The total amount of waste and the amount of pure fractions may thus be too low, while the share of mixed waste may be too high. For some industries the sample coverage (share of the population within the sample) is low. This, in combination with great variation in waste generation per employee, gives uncertain calculations for these industries. The precision is improved due to better sample coverage in this survey compared to previous calculations by Statistics Norway. Hazardous waste and scrapped vehicles are currently not included in the figures. |
Tables:
Contact
-
Camilla Skjerpen
E-mail: camilla.skjerpen@ssb.no
tel.: (+47) 48 22 72 14
-
Gisle Berge
E-mail: gisle.berge@ssb.no
tel.: (+47) 48 12 19 97