Content
Published:
1 per cent of Norway’s waste amount
The Central government disposed of 89 200 tonnes of waste in 2008. Half of this arose from health and social activities. On average, each employee contributed 395 kg of waste in 2008. The service industries generated twice as much waste per employee than the Central government.
For the first time, waste statistics concerning only the Central government have been published. This is done in connection with the project State resource use and results (StatRes). The figures presented in this article include the activities health and social work, education, defence, compulsory social security. These represent about 96 per cent of all governmental employees. More about StatRes here. |
Central government health and social work activities disposed of 45 000 tonnes of waste in 2008, which constitutes half of the waste from the Central government. At the same time half of the governmental employees worked with health and social related issues. Waste from the entire health and social industry amounts to about 200 000 tonnes. Of this, the Central government constituted 23 per cent.
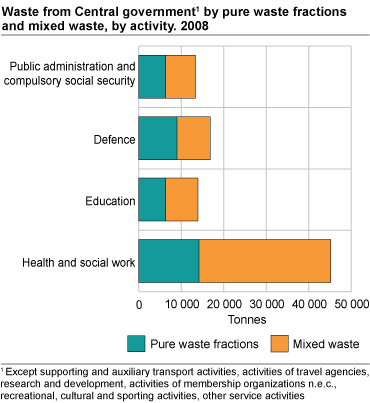
Defence and education activities disposed of 17 000 and 14 000 tonnes of waste respectively, constituting 19 and 16 per cent of the total waste amounts.
The waste amounts from the Central government comprised nearly 6 per cent of the waste from the service industries. Considering that the governmental employees amount to 14 per cent of all the employees in the service industries, the governmental employees generated, on average, half as much waste as employees in the service industries.
Most mixed waste
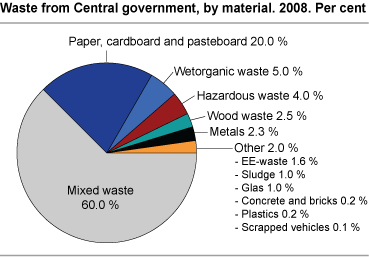
A significant part, about 60 per cent, was collected as mixed waste. The share of mixed waste varied with the activities from 47 per cent in defence to nearly 69 per cent in health and social activities. One fifth of the waste was paper and cardboard. The largest shares were found in public administration and compulsory social security and education; 35 and 30 per cent respectively.
About 4 400 tonnes was so-called wet organic waste, mainly containing food waste, but also a smaller amount of paper towels and vegetative leftovers.
About the figuresThe calculations are based on customer registers from a selection of waste collectors. Some of the customers may have delivered a few pure waste fractions to waste collectors outside the selection, or to recipients outside the waste collection business. The total amount of waste and the amount of pure fractions may thus be too low, while the share of mixed waste may be too high.
The statistics comprise public administration and defence, compulsory social security, education and health and social activities. As a consequence of lacking data, basis figures for the remaining activities are not presented here. In total the employees in the excluded activities amount to about 3.5 per cent.
Central government disposal of waste is part of the statistics covering waste from service industries. Figures for the service industries are available here . |
Tables:
Contact
-
Statistics Norway's Information Centre
E-mail: informasjon@ssb.no
tel.: (+47) 21 09 46 42