Content
Published:
This is an archived release.
Reduced NOX emissions from navigation
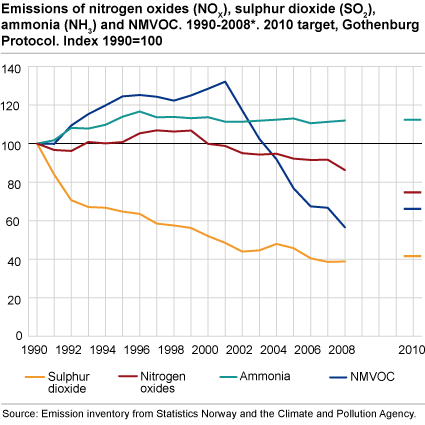
The emissions of nitrogen oxides (NOX) from domestic navigation and fishing were 11 per cent lower in 2008 compared to 2007. The collective NOX emissions have been reduced by 14 per cent since 1990, but further reductions are necessary to reach the target in the Gothenburg protocol. The obligations are most likely reached for NMVOC, NH3 and SO2.
The Norwegian emission inventory is compiled by Statistics Norway in close collaboration with the Climate and pollution agency.
New, detailed source and industry distributed figures on emissions of nitrogen oxides, NMVOC, sulphur dioxide and ammonia in 2008 are now available. The quality of energy data and reported emission data from the industry are improved compared to the previous publication. In addition, methodological improvements have been performed for coastal traffic and fishing.
| Component | Emissions 1990 | Emissions 2008* | Emission ceiling 2010 | Necessary reduction 2008-2010 | |||||||||||||||||||||||||||||||||||||||||||||||||||||||||||||||||||||||||||
|---|---|---|---|---|---|---|---|---|---|---|---|---|---|---|---|---|---|---|---|---|---|---|---|---|---|---|---|---|---|---|---|---|---|---|---|---|---|---|---|---|---|---|---|---|---|---|---|---|---|---|---|---|---|---|---|---|---|---|---|---|---|---|---|---|---|---|---|---|---|---|---|---|---|---|---|---|---|---|---|
| Nitrogen oxides (NOX) | 203 918 | 175 885 | 156 000 | 19 900 tonnes (11 per cent) | |||||||||||||||||||||||||||||||||||||||||||||||||||||||||||||||||||||||||||
| Sulphur dioxide (SO2) | 52 198 | 20 269 | 22 000 | Emission ceiling appr. reached at the moment | |||||||||||||||||||||||||||||||||||||||||||||||||||||||||||||||||||||||||||
| NMVOC | 299 923 | 169 674 | 195 000 | Emission ceiling appr. reached at the moment | |||||||||||||||||||||||||||||||||||||||||||||||||||||||||||||||||||||||||||
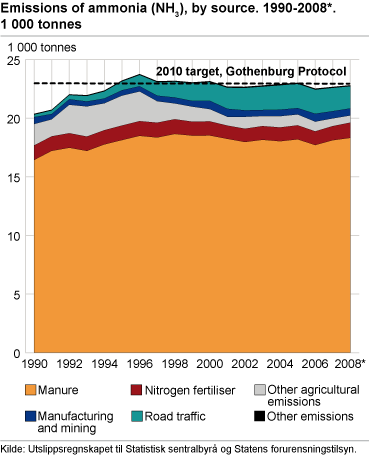
| Ammonia (NH3) | 20 377 | 22 810 | 23 000 | Emission ceiling appr. reached at the moment | |||||||||||||||||||||||||||||||||||||||||||||||||||||||||||||||||||||||||||
| Source: Emission inventory from Statistics Norway and the Climate and Pollution Agency. |
Reductions in NOX emissions from domestic navigation and fishing
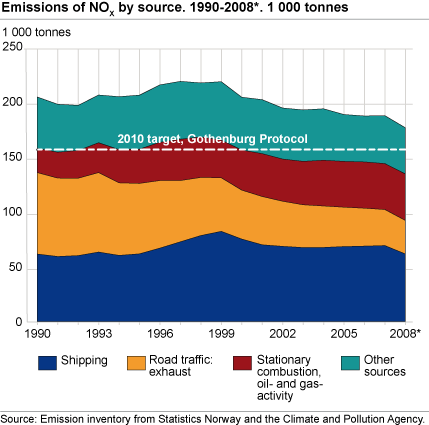
In 2008, the NOX emissions from domestic navigation (coastal traffic and mobile installations) and fishing were 61 400 tonnes. This is approximately the same emission level as in 1990, after a peak in emissions of 82 000 tonnes in 1999.
Emissions from coastal traffic were reduced by 6 700 tonnes, or 14 per cent, from 2007 to 2008, and emissions from this source comprised 62 per cent of the total reductions in NOX emissions. The reductions in emissions were due to reduced fuel consumption, partly as a result of reduction measures financed by the Business Sector’s NOx fund, organised by the Confederation of Norwegian Business and Industry, and a gradual phasing out of aging engines with high emissions. However, there is a degree of uncertainty related to the consumption figures for domestic navigation, due to uncertain sales statistics for petroleum products.
Since the previous publication, the emission factors for NOX from domestic navigation and fishing have been revised, and this has led to a reduction in estimated emissions for the whole time series 1990-2008.
New NOX emissions factors for domestic navigationA measuring program for NOx emissions from ships has been performed, managed by the Confederation of Norwegian Business and Industry (through the NOx fund). New base emission factors from Marintek give emissions of NOx for different types of engines built before and after emission restrictions were introduced in 2000. The base factors are weighted according to the distribution of engine types within the different categories of ships. Subsequently, they are weighted according to consumption for the different categories of svips. This calculation is performed for base years with good consumption data (1993, 1998, 2004 and 2007). Mean emission factors are calculated for the different industries in the national emission model, and are then interpolated over the time series and used in the yearly emission calculation. |
Further reductions needed to reach the target for NOX emissions
The total emissions of NOX in 2008 were 175 900 tonnes, which is a reduction of 6 per cent since 2007 and 14 per cent since 1990. An additional reduction of 11 per cent is required to reach the 2010 emission target of 156 000 tonnes. The calculation model for emissions from road traffic is to be updated in 2010, and this may affect the calculated emissions.
The most important emission sources for NOX is domestic navigation and shipping (35 per cent), stationary combustion within the oil and gas industry (24 per cent, of which 79 per cent from natural gas), and from road traffic (17 per cent, of which 70 per cent is from diesel vehicles).
The most profound change since 1990 has been in emissions of NOX from passenger cars with petrol engines. In 1990, they were responsible for 24 per cent of the total NOX emissions in Norway, while emissions from such vehicles comprised just five per cent of total emissions in 2008. The share of total NOX emissions from stationary combustion within the oil and gas industry has on the other hand increased from 11 to 24 per cent since 1990. The main reason is increased combustion of natural gas in electricity producing turbines on the continental shelf.
Effective measures for NMVOC
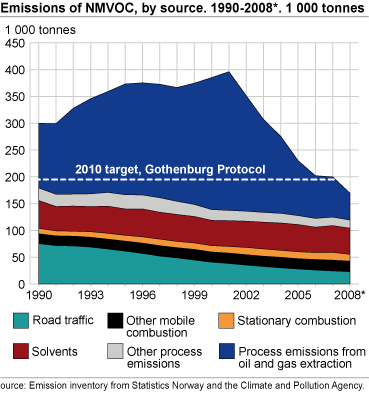
The emissions of NMVOC (volatile organic compounds, except methane) were 169 700 tonnes in 2008. This is well below the obligations according to the Gothenburg protocol, in which Norway has committed to reducing their NMVOC emissions below 195 000 tonnes by 2010.
Sulphur dioxide and ammonia below reduction obligations
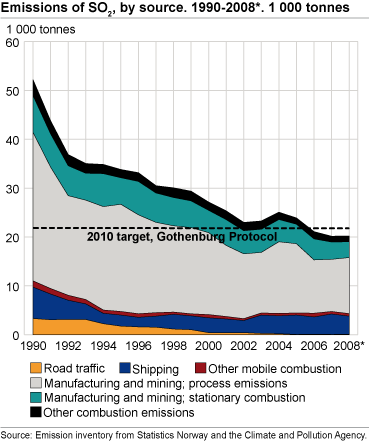
The emissions of sulphur dioxide (SO2) were 20 300 tonnes in 2008; an increase of one per cent since 2007. From 1990, these emissions have been reduced by 61 per cent, and have from 2006 been below the obligations according to the Gothenburg protocol, in which the emission ceiling has been set to 22 000 tonnes by 2010.
The emissions of ammonia (NH3) were 22 800 tonnes in 2008, just below the target in the emission obligations for 2010 (23 000 tonnes). The emissions have been stable for several years. Eighty-nine per cent of these emissions stem from agriculture, of which 91 per cent stem from storage and use of manure.
Decline in emissions of acidifying substances
The collective emissions of acidifying substances, measured in acid equivalents, were 5 799 tonnes in 2008. NOX comprises 66 per cent of this, and NH3 and SO223 and 11 per cent respectively. The reduction in emissions of acidifying substances since 1990 has been 20 per cent.
About the emission inventoryRead more about acid equivalents and international obligations . See also emission figures for greenhouse gases and hazardous substances . |
Tables:
The statistics is published with Emissions to air.
Contact
-
Statistics Norway's Information Centre
E-mail: informasjon@ssb.no
tel.: (+47) 21 09 46 42

