Content
Published:
This is an archived release.
Emissions below NMVOC target
Considerable cuts in emissions of hydro carbons (NMVOC) from loading of oil on the continental shelf have translated into emissions below the obligation level in the Gothenburg Protocol. There was only a minor decline in emissions of nitrogen oxides (NOX) in 2007.
For the NOX emissions, the emission obligation for 2010 is still a long way off.
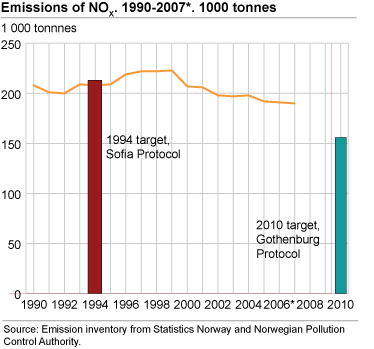
In order to fulfil the emission obligation for NOx the emissions must be reduced by 18 per cent compared to the 2007 level. The Norwegian Government and 14 trade associations have entered into a new environmental agreement on NOx reducing measures, intending to make fulfilment of the emission obligation possible.
This article presents preliminary emission figures for 2007, estimated by Statistics Norway in close cooperation with the Norwegian Pollution Control Authority.
NMVOC emissions below the obligation level for 2010
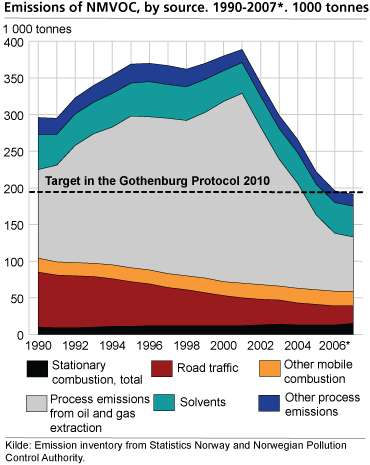
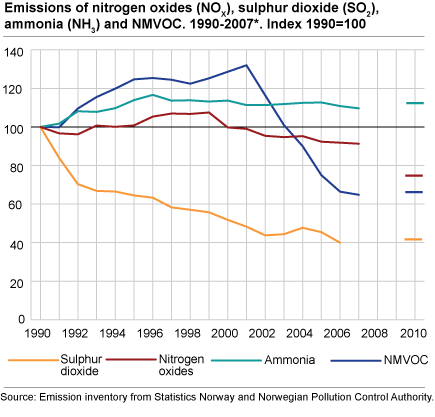
The NMVOC emissions in 2007 totalled 191 000 tonnes, which is less than half of the level in the peak year 2001. This means that Norway for the first time achieved emissions below 195 000 tonnes, which is the obligation for 2010 in the Gothenburg Protocol. The main part of this decrease took place in the period 2001-2006, whereas the decrease from 2006 to 2007 was no more than 2 per cent. The Gothenburg protocol is an international agreement that covers transboundary air pollutants. The Gothenburg protocol has been ratified by most European countries and the US.
It is primarily lower emissions from loading and storing of crude oil on the continental shelf that has caused the decrease in emissions since 2001, and this was also the main cause for the decrease in 2007. In 2007, 86 per cent of the loading of oil took place at installations with NMVOC reducing equipment. The Norwegian Pollution Control Authority had imposed that within 2007, 95 per cent of all loading of oil should be done using technology that limits NMVOC emissions. The decrease in emissions of loading of oil was partly offset by emissions caused by technical problems at the new LNG plant on Melkøya outside Hammerfest.
Emissions of NMVOC from road traffic have fallen by almost 70 per cent since 1990. The decrease has been constant throughout the whole period and continued in 2007. The decrease is a result of the requirements for exhaust gas purification which were introduced in 1989.
| Component | Emissions 1990 | Emissions 2007* | Emission ceiling 2010 | Necessary reduction 2007-2010 | |||||||||||||||||||||||||||||||||||
|---|---|---|---|---|---|---|---|---|---|---|---|---|---|---|---|---|---|---|---|---|---|---|---|---|---|---|---|---|---|---|---|---|---|---|---|---|---|---|---|
| Nitrogen oxides (NOX) | 207 712 | 189 638 | 156 000 | 34 000 tonnes (18 per cent) | |||||||||||||||||||||||||||||||||||
| NMVOC | 295 280 | 191 370 | 195 000 | Emission ceiling appr. reached at the moment | |||||||||||||||||||||||||||||||||||
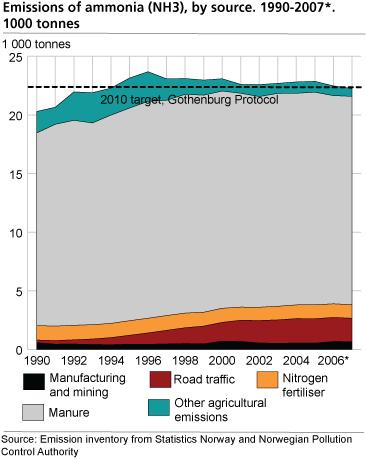
| Ammonia (NH3) | 20 375 | 22 341 | 23 000 | Emission ceiling appr. reached at the moment | |||||||||||||||||||||||||||||||||||
| Source: Emission inventory from Statistics Norway and Norwegian Pollution Control Authority. |
Minor reduction in NOX emissions
In 2007, the Norwegian emissions of NOX totalled 190 000 tonnes, a decrease of 0.6 per cent from 2006. Emissions from road traffic, sea transport and fishing decreased from the preceding year, but were offset by large emissions from the LNG plant on Melkøya and increased activity in the ferroalloy industry.
The decrease in emissions from road traffic is due to requirements for exhaust gas purification, which were imposed in 1989. The share of petrol cars equipped with catalytic converters is still rising (see below) and the heavy vehicles have also reduced their emissions because of joint European exhaust gas requirements. In 2007, three out of four sold passenger cars were diesel-powered. This is a strong increase from 2006, when just above half of new passenger cars were diesel-powered. The change is due to the introduction of a CO2 clause in the non-recurrent fee on passenger cars. This trend has continued into the first months of 2008. The NOx tax introduced in 2007 (see box) may have influenced the decrease in emissions from sea transport and fishing.
The NOX emissions have been reduced by 8.7 per cent since 1990, but need to be reduced by a further 18 per cent from the 2007 level, i.e. 34 000 tonnes, by 2010 if Norway is to fulfil the obligation in the Gothenburg Protocol (156 000 tonnes).
Three emission sources dominate the NOx emissions
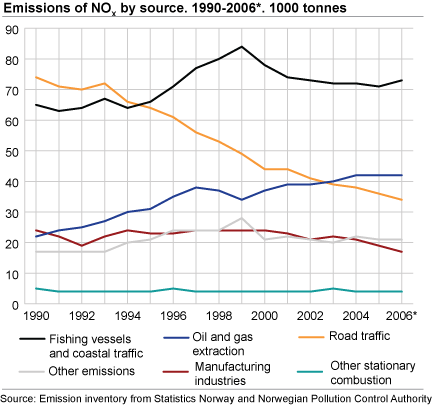
The quality of the 2007 figures is not sufficient to describe the different emission sources in detail. Instead, a more thorough description of the 2006 figures is presented. The three emission sources domestic sea transport and fishing, oil and gas activities and road traffic together accounted for 79 per cent of the NOx emissions in 2006. The remainder came mainly from oil used for heating and other combustion, air transport and use of motorised equipment.
Domestic sea transport and fishing had the largest NOX emissions in 2006, 73 000 tonnes or 38 per cent of the total emissions. The emissions from this source have increased considerably since 1990, and are now 12 per cent above the 1990 level. Emissions from fishing accounted for 23 000 tonnes, and the rest came from coastal traffic, ferries, supply ships, mobile oil rigs etc.
In 2006, 42 000 tonnes, or 22 per cent of the NOx emissions, came from oil and gas activities. As for domestic sea transport and fishing, this is an important emission source, not only because the emissions are substantial, but also because the emissions have increased considerably since 1990: The emissions from oil and gas activities have increased by 90 per cent in the period. Most of the increase, however, took place in the 1990s, and during the last three years the emission level has been relatively stable.
Emissions from mobile oil rigs are included in shipping , not in oil and gas activities . Emissions from drilling are regulated by the Petroleum Act and are considered as part of the oil and gas industry in some other presentations, e.g. from the Norwegian Oil Industry Association. In 2006, 9 200 tonnes NOx were emitted during drilling from mobile rigs.
NOX emissions from road traffic have been more than halved since 1990. The main reason for this decline is the introduction of catalytic converters in petrol vehicles in 1989. The emissions have decreased steadily since catalytic converters became obligatory. In 2006, 34 000 tonnes, or 18 per cent of the total NOx emissions, came from road traffic. The emissions from heavy diesel vehicles have also decreased, following the introduction of emission requirements for heavy vehicles in 1993.
Small decrease in ammonia emissions
The emissions of ammonia were somewhat reduced from 2006 to 2007, and totalled 22 300 tonnes in 2007. This is slightly below the obligation in the Gothenburg Protocol (23 000 tonnes).
Greenhouse gas figures also published today
Go to article on greenhouse gas emissions .
NOX reducing measuresIn autumn 2006, the Norwegian Parliament passed a tax on emissions of NOX valid from 1 January 2007. The tax amounts to NOK 15 per kg NOX . emitted. It comprises ships, fishing vessels, air traffic and diesel railways, and also engines, boilers and turbines in energy plants in the manufacturing industries. Only large units are comprised by the tax. Large units are defined as units with capacity higher than 10 MW for boilers and 750 kW (1020 hp) for propulsion engines. In addition, NOx tax is imposed on flaring offshore and on oil and gas installations onshore. The tax covers approximately 55 per cent of the total Norwegian NOx emissions. The tax is geographically delimited in accordance with the Gothenburg Protocol. This implies, for instance, that emissions from foreign sea and air transport are not included. |
Preliminary figures
The figures presented in this article are preliminary, but are relatively reliable. This particularly applies to total emission figures. However, detailed tables for 2007, including distributions between source and industry, will not be published until February 2009.
For more information, see The Norwegian Emission Inventory. Documentation of methodologies for estimating emissions of greenhouse gases and long-range transboundary air pollutants (Rapport 2007/38).
Tables:
The statistics is published with Emissions to air.
Contact
-
Statistics Norway's Information Centre
E-mail: informasjon@ssb.no
tel.: (+47) 21 09 46 42

