Content
Published:
This is an archived release.
Wrong direction for NOX emissions
Emissions of NOX came to 220 000 tonnes in 2003. Following a decline from 1999 to 2002, the emissions rose by 9 000 tonnes from 2002 to 2003. This is 2 per cent lower than in 1990. In the Gothenburg Protocol, Norway is committed to reducing emissions of nitrogen oxides (NOX) to 156 000 tonnes by 2010.
The calculations are carried out by Statistics Norway and the Norwegian Pollution Control Authority. Preliminary figures for 2003 were first published in April 2004.
According to the Gothenburg Protocol, Norway is committed to ensuring that emissions do not exceed the limits set for (SO2), nitrogen oxides (NOX), ammonia (NH3) and volatile organic compounds (NMVOC). The emission ceilings have been negotiated, based on critical loads for acid rain and ground-level ozone.
| Emission ceiling 2010 according to the Gothenburg Protocol. Status 2003 and prognosis 2010. Tonnes (per cent) |
| Component | Emissions 1990 | Emissions 2003 | Emission ceiling 2010 | Prognosis 2010 | Necessary reduction 2003-2010 | ||||||||||||||||||||||||||||||||||
|---|---|---|---|---|---|---|---|---|---|---|---|---|---|---|---|---|---|---|---|---|---|---|---|---|---|---|---|---|---|---|---|---|---|---|---|---|---|---|---|
| Nitrogen oxides (NOX) | 223 878 | 220 169 | 156 000 | 200 800 | 64 000 tonnes (29 per cent) | ||||||||||||||||||||||||||||||||||
| NMVOC | 294 529 | 300 087 | 195 000 | 168 800 | 105 000 tonnes (35 per cent) | ||||||||||||||||||||||||||||||||||
| Sulphur dioxide (SO2) | 51 904 | 22 815 | 22 000 | 26 900 | 800 tonnes (4 per cent) | ||||||||||||||||||||||||||||||||||
| Ammonia (NH3) | 20 375 | 22 796 | 23 000 | 23 600 | Emission ceiling reached at the moment | ||||||||||||||||||||||||||||||||||
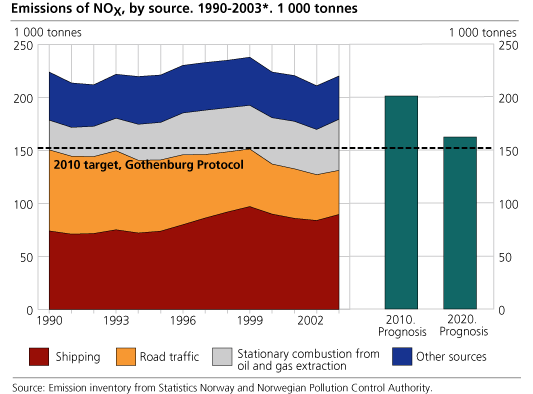
In 2003, the emissions of NOX were 220 000 tonnes. This is 9 000 tonnes or 4 per cent higher than in 2002 and almost 2 per cent lower than in 1990. Norway's emissions according to the Gothenburg Protocol must not exceed 156 000 tonnes by 2010, and thus must be reduced by 29 per cent.
In 2003, domestic shipping and fishing accounted for 40 per cent of Norway's NOX emissions. Oil and gas extraction contributed to 19 per cent. Since 1990, the share of the emissions related to these sources has been increasing. The share from road traffic was 22 per cent in 2003. This share has dropped since 1990 due to restrictions on exhaust emissions. 9 per cent came from industrial processes and combustion.
The increasing emissions from oil and gas extraction are caused by increased electricity production on the continental shelf.
The increase in NOX emissions was somewhat moderated by reduced emissions from road traffic because of a reduction in the number of cars without catalytic converters. Emissions from fishing dropped in 2003 and process emissions from the manufacturing industries were also reduced, particularly because of lower activity within manufacture of iron, steel and ferroalloys.
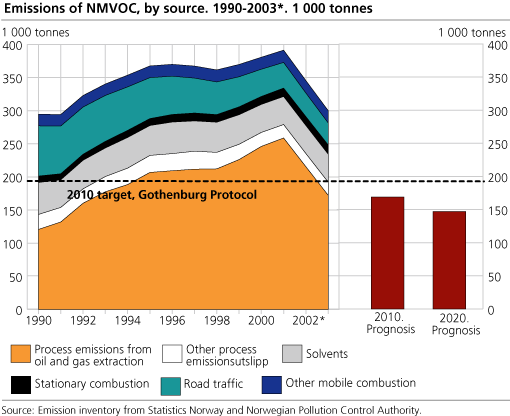
NMVOC reduced by 13 per cent
The emissions of NMVOCs (non-methane volatile organic compounds) increased throughout the 1990s and reached a peak in 2001. Since then, the emissions have fallen considerably and were estimated to 300 000 tonnes in 2003. More than half of the NMVOC emissions came from loading and storing of oil, and the reduction is due to recovery facilities for oil vapour at the terminals and by loading and storing of oil. The total NMVOC emissions dropped by 13 per cent to 300 000 tonnes from 2002 to 2003. On the continental shelf, the emissions were reduced by 21 per cent.
Despite the sharp reduction over the last years, Norway failed to keep within the limits of the Geneva Protocol in 1999. The emissions are still very high and will have to be reduced by 35 per cent to meet the target in the Gothenburg Protocol, 195 000 tonnes, in 2010.
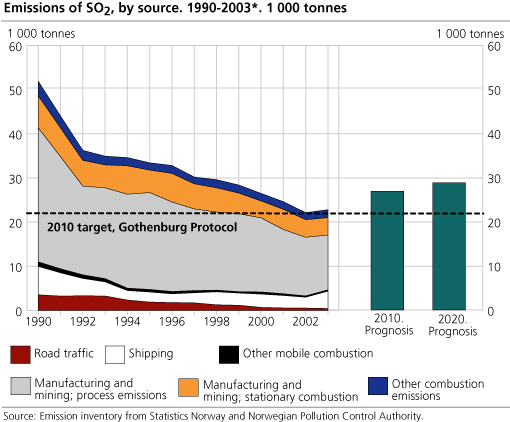
Sulphur emissions up in 2003
After nearly 20 years of continuous decrease, the emissions of sulphur dioxide rose from 2002 to 2003 and totalled 22 800 tonnes. This was an increase of 3 per cent compared with the previous year and can be explained by higher fuel consumption in domestic shipping and the change to fuel types with higher sulphur content.
Lower sulphur content in heating oil and petrol and reduced activity in the process industry dampen the effect.
According to the Gothenburg Protocol, the emissions must not exceed 22 000 tonnes by 2010.
54 per cent of the SO2 emissions in 2003 originated from various industrial processes and 17 per cent from industrial combustion. Thus, the manufacturing industries accounted for almost three quarters of the SO2 emissions. Domestic shipping and fishing contributed to 17 per cent, while the rest (11 per cent) came from heating of houses, road traffic, air traffic, oil and gas extraction and other industries.
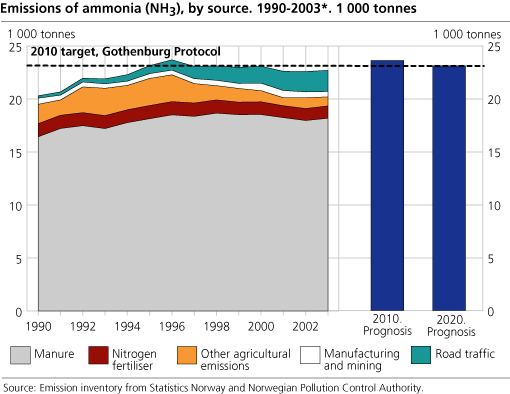
Only minor changes in ammonia emissions
In 2003, 22 800 tonnes of ammonia were emitted. This is 100 tonnes higher than in 2002 and just below the obligation of the Gothenburg Protocol (23 000 tonnes in 2010). In 2003, 89 per cent of the emissions came from agriculture (particularly livestock manure), 9 per cent from petrol cars and 2 per cent from manufacturing industries.
New emission figures
Other emission figures are also being published: Emissions to air of greenhouse gases and Emissions to air of persistent organic pollutants and heavy metals .
Read more about emissions to air:
NOS Emissions to air 1973-2003
State of the environment Norway
See more emission figures in StatBank
Tables:
The statistics is published with Emissions to air.
Contact
-
Statistics Norway's Information Centre
E-mail: informasjon@ssb.no
tel.: (+47) 21 09 46 42