Content
Published:
This is an archived release.
Further reduction in nitrogen oxides emissions
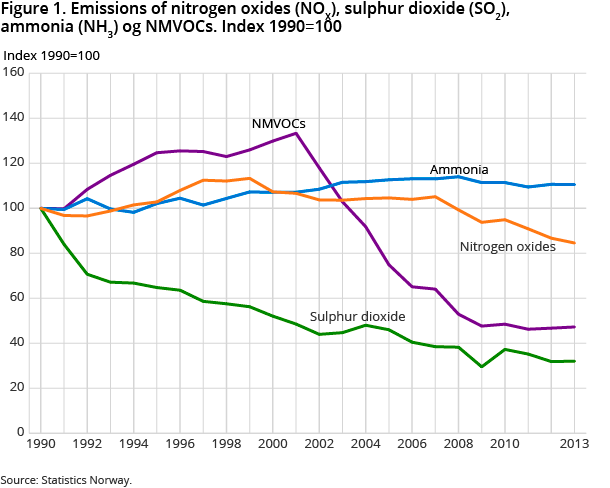
Norway emitted 162 000 tonnes of nitrogen oxides (NO X ) in 2013; a 2.4 per cent decline from 2012. This is mainly due to a lower consumption of marine fuels. The emissions of other acidifying gases (SO 2 and NH 3 ) were steady.
| 2013 | Change in per cent | ||
|---|---|---|---|
| Since 1990 | 2012 - 2013 | ||
| 1Does not include international sea and air traffic. | |||
| Nitrogen oxides (NOX) | 162 | -15.4 | -2.4 |
| Sulphur dioxide (SO2) | 17 | -67.9 | 0.6 |
| Ammonia (NH3) | 27 | 10.5 | -0.1 |
| Non-methane volatile organic compounds (NMVOC) | 139 | -52.7 | 1.1 |
| Carbon monoxide (CO) | 281 | -62.3 | -6.4 |


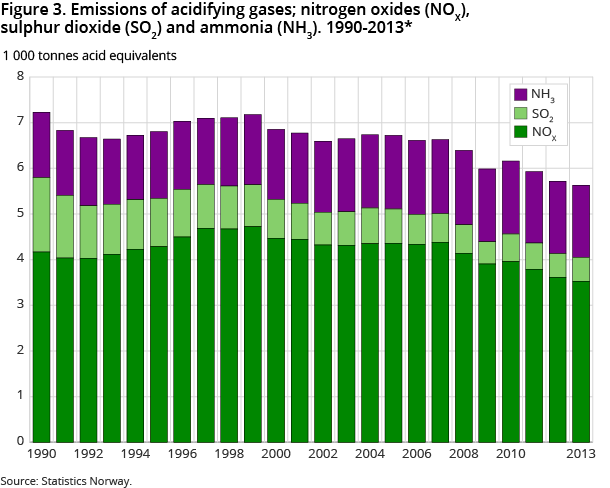
The preliminary emission figures show that the amount of acidifying emissions, given in acid equivalents , dropped by 1.5 per cent from 2012 to 2013. This was due to a reduction in the emission of nitrogen oxides (NO X ). A slight increase is seen in the emission of volatile organic carbon (NMVOC), after several years of decline, while the carbon monoxide (CO) emissions fell significantly.
Reduced nitrogen emissions from activities at sea
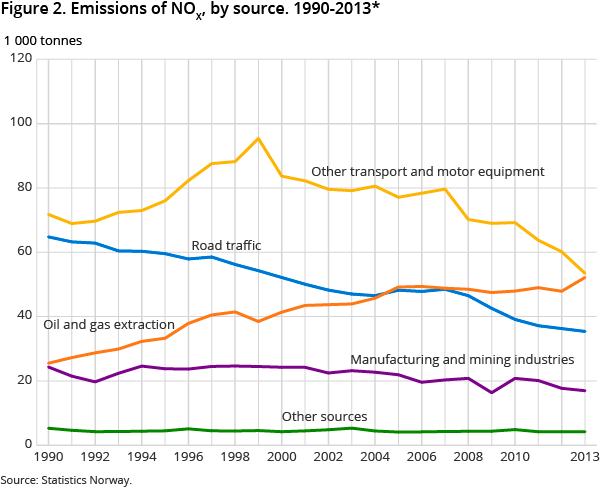
Total NO X emissions in 2013 are estimated at 162 000 tonnes, compared to 166 000 tonnes the year before. The decline is mainly due to reduced emissions from marine fuel use. The preliminary figures indicate a drop in the domestic fishing and shipping emissions, and slightly higher emissions from oil and gas extraction.
According to the Gothenburg Protocol definition, the Norwegian emissions were 160 000 tonnes in 2013 and 164 000 tonnes the previous year. The preliminary figures therefore indicate that the 2013 emissions ended about 3 per cent above the ceiling in the Gothenburg Protocol.
Steady sulphur emissions
The sulphur dioxide (SO 2 ) emission remained almost unchanged from 2012 to 2013, and ended at 16 800 tonnes. About two thirds was generated from manufacturing and mining. The 2013 emissions were 24 per cent below the obligation set in the Gothenburg Protocol.
Ammonia emissions still exceeding obligation
The ammonia (NH 3 ) emission was practically the same in 2013 as in 2012. Agriculture is the dominating source, emitting 92 per cent of the national amount. Total emission in 2013 is estimated at 26 900 tonnes, which is 17 per cent more than the obligation set by the Gothenburg Protocol.
Increased NMVOC emissions from oil and gas extraction
The emission of volatile organic carbon (NMVOC) rose by 1.1 per cent in 2013, after an 11-year continual decline, and ended at 139 000 tonnes. A 10 per cent emission growth was seen within oil and gas extraction, due to increased due to increased emissions from offshore storage and loading of crude oil, which caused the growth in total emissions1). The NMVOC emissions are still well below the Gothenburg Protocol obligation.
CO emissions going down
About 281 000 tonnes of CO gas were emitted in 2013; a 6 per cent drop from the previous year. The drop is mainly due to reduced firewood consumption in households, and a shift to diesel cars and general renewal of the car fleet. The figures are somewhat uncertain.
Preliminary figures
The preliminary figures will be revised in January/February 2015. The revised figures will contain more detailed classifications by source and industry.
1) The sentence was changed 14 May 2014 at 11:30 a.m.
Figures comprise emissions from Norwegian territoryOpen and readClose
The figures comprise emissions from Norwegian territory. Some tables also provide emissions from international aviation and shipping.
Norway is committed to further reductionOpen and readClose
In the EU directive 2001/81/EF (NEC), which through the EEA agreement also applies to Norway, the countries are committed to the same obligations as the Gothenburg protocol .
The delimitation of which emissions are to be counted as Norwegian, is slightly different in the Gothenburg Protocol than in Statistics Norway’s emission statistics. The difference relates to aviation, where the emission statistics cover all emissions from domestic aviation, while the Gothenburg Protocol covers landing and take-off only, but includes international flights by both Norwegian and foreign companies. The emissions tend to be slightly lower according to the Gothenburg Protocol than in Statistics Norway’s emission statistics.
The statistics is published with Emissions to air.
Contact
-
Statistics Norway's Information Centre
E-mail: informasjon@ssb.no
tel.: (+47) 21 09 46 42
