NOU 2005:5 Simple signals in a complex world
Is Norway sustainable?
Published:
Today the expert committee on sustainable development delivered their report to the Minister of Finance, Per Kristian Foss. The committee proposes a set of 16 indicators that illustrate both the state of and potential threats for several priority areas defined by the Government and also the status for different components of our national wealth.
In December 2003, the Norwegian Government appointed an expert committee that was given the task to develop a set of indicators for sustainable development for Norway. The main purpose of the indicators is to provide information, evaluation and follow-up of the Government's action plan for sustainable development: National Agenda 21. The leader of the committee has been Knut H. Alfsen, Director of Research at Statistics Norway. The committee proposes that Statistics Norway is given the main technical responsibility for the indicators, including coordination of data collection and the periodic presentation of the indicators.
In the report the committee proposes a set of 16 indicators that illustrates both the state of and potential threats for several priority areas defined by the Government and also the status for different components of our national wealth. The priority areas include: 1. Climate, ozone and long-range transported air pollution, 2. Biodiversity and cultural heritage, 3. Hazardous substances, 4. Natural resources, 5. Sustainable economy, and 6. Social areas of direct significance for sustainable development. The indicators show a picture of Norway with few acute problems, but with challenges concerning future greenhouse gas emissions, public finances, exclusion from the labour market, and global income equalization through increased trade with the least developed countries. The indicators also show that it is particularly important to manage our human resources in a proper way. Manpower and competence are the two most important sources of future income, even in petroleum-rich Norway.
The committee points to the challenge of determining whether the development is sustainable or not, since sustainability is about what will or may happen in the long term . The committee has applied a capital approach in the development of the indicator set. The reason for this is that our welfare today and in future may be considered as return on our total national wealth . This wealth consists of fixed assets such as machines, tools and buildings, natural resources like oil, gas, fish, forests and soil, environmental goods like clean air and water, and last but not least, manpower, knowledge and competence that constitute the human capital . If we shall manage to maintain and preferably increase our welfare in the long term, the national wealth must be conserved or preferably increased. Policies that ensure a sensible management of the total national wealth are therefore a prerequisite for a sustainable development.
The national wealth consists of many different components that can not always be substituted for each other. It is therefore necessary to have several indicators that can show how the various components of the national wealth are developing.
Several serious challenges for sustainable development are of primarily international character, and are therefore not captured by the Norwegian national wealth. For example UN's Millennium Goals, adopted in year 2000, establish clear targets for the reduction of global poverty. Norway is also committed to a number of global or regional conventions and agreements in the environmental area. Therefore, the proposed national indicator set for Norway also includes indicators of Norwegian efforts or influences related to such challenges.
The committee proposes that Statistics Norway is given the main technical responsibility for the indicators including the coordination of data collection and the periodic presentation of the indicators. It is also desirable that these indicators are used when the Government discusses long-term policy issues related to sustainable development in central policy documents such as the National Budget.
A general overview of the indicator set is presented below, together with figures and brief descriptions.
|
Issues that the indicators shall cover |
Indicators |
Short description of the indicators |
|
|
1 |
Climate change |
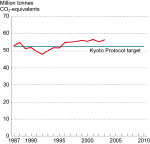
The report "Impacts of a Warming Arctic" points out that the temperature increase in the latest decades has been nearly twice as fast in the Arctic areas as in other areas of the world. The climate change may have considerable effects on the environment, resources, society and economy. Not all the effects will be negative, but changes can nevertheless represent big challenges for society. Greenhouse gas emissions in Norway rose by 2 per cent from 2002 to 2003. The overall rise since 1990, the base year for the Kyoto Protocol, is 9 per cent. The rise in 2003 was almost entirely due to a 5 per cent increase in CO 2 emissions. This in turn is explained by higher emissions from the oil and gas industry on the continental shelf and onshore. High electricity prices in 2003 resulted in a sharp rise in fuel oil consumption, which in turn resulted in substantial CO 2 emissions. Emissions from the use of autodiesel in cars and marine gas oil by domestic shipping are also rising. |
|
|
2 |
Acidification |
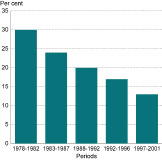
Acidification is still an important environmental problem in Norway, even though reduced emissions have improved the conditions somewhat. The effects have been observed particularly in Southern Norway, the southern parts of Western Norway, and Eastern Norway. Sør-Varanger municipality in Finnmark suffers the effects of acid rain from sources in northern Russia. At the beginning of the 1980s the critical loads were exceeded across 30 per cent of the total area of Norway. European emissions of acidifying gases have been reduced and consequently the pressure on Norwegian nature has been reduced. Around year 2000, the critical loads were exceeded across 13 per cent of the total area. The greatest improvements have occurred in Eastern Norway. With the reductions in emissions expected by 2010, it has been calculated that critical loads will still be exceeded in an area corresponding to 7-8 per cent of the total area of Norway. Fish mortality and damage to fish stocks will therefore continue unless preventive measures such as liming are also kept up. |
|
|
3 |
Terrestrial ecosystems |
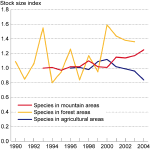
The trends of different bird stocks are considered to give a good indication of the state of their habitats. In mountain areas, there has been an increase in the stock of nesting birds. This is an expected trend caused by warmer climate and a denser mountain forest. The figures for forest birds show large variations from year to year and no clear trend. This may be caused by real variations of stocks, but may also be a result of the data collection method. In agricultural areas the stock trends are also uncertain. The three data series shown are all based on incomplete data and are not representative for the country as a whole. The data used for this indicator needs further development. |
|
|
4 |
Fresh water ecosystems |
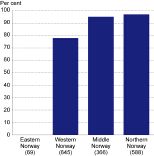
The choice of indicators for aquatic ecosystems is based on recommendations from the Directorate for Nature Management. The indicators are clearly policy relevant, as they are connected to the EU water framework directive. According to this directive ecological status of inland and coastal water localities shall be classified into five categories: high, good, moderate, poor and bad. Each member country must develop classification methods and monitoring systems. Most inland and coastal waters in Norway have a good ecological status. This is especially the case in the more sparsely populated areas (Western, Middle and Northern Norway). The conditions seem to be somewhat worse in Eastern Norway, especially in coastal waters. Here, none of the assessed localities have been categorised as clearly good. The figures are preliminary and a number of localities with uncertain ecological status will probably be classified as good after a closer assessment, also localities in coastal waters in Eastern Norway. |
|
|
5 |
Coastal ecosystems |
||
|
6 |
Efficiency of resource use |
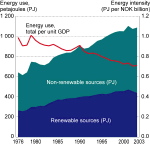
In modern economies, energy is an essential input factor, and energy production and use have consequences irrespective of energy source such as air emissions, water pollution, waste problems and impacts on landscape and biodiversity. With the exception of the years around 1980 and 1990, the Norwegian economy has had a stronger growth in its wealth creation measured as GDP than in domestic energy use, although energy use has also increased substantially. From 1976 to 2003 the energy use increased by 69 per cent. However, the GDP growth in the same period was 135 per cent. The energy intensity, measured as energy use per unit GDP, has therefore decreased in the period, implying a more efficient energy use. |
|
|
7 |
Management of renewable resources |
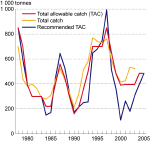
Fishing has been an important basis for settlement and economy during all of Norway's history. Sustainable management of fish resources implies that they should not be exploited to such a degree that there is a high probability of poor recruitment. Without sufficient recruitment, the basis for a long-term and sustainable exploitation of this resource is destroyed. The stock of Northeast Arctic cod is jointly managed by Norway and Russia. The TACs (total allowable catch) are now set according to a new decision rule. In short, a 3-year horizon of the quota (TAC) level has been adopted, there are rules for how much the quotas can vary in the period, and rules for how to set the quota in relation to spawning stock size and fishing mortality. Looking at the period 1978-2003, the accumulated catches have been about 600 000 tonnes above the TAC. Figures for unreported catches have been added to the registered catches for several years in the period. On the whole, one may say that registered catches are well in accordance with the TAC. |
|
|
8 |
Hazardous substances |
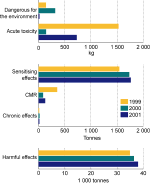
In recent years there has been an increased awareness of the relations between exposure to hazardous substances and health effects in humans. Such substances also have adverse and long-lasting effects on the environment. This should have clear consequences for how to consider emissions and use of hazardous substances in a sustainable development perspective. The use of cancer-causing, genetically harmful agents or agents harmful to human reproduction was reduced by more than 60 per cent from 1999 to 2001. The reason for the decrease was that the industry used less of such products after a fee was imposed on perchloroethylene that is used for cleaning products. The use of allergy-causing agents increased by 14 per cent in the same period. The use of allergy-causing (sensitising) agents increased by 200 tonnes or 14 per cent from 1999 to 2001. The main reason for this is increased use of paint and varnish products, plus cleaning products classified as allergy causing. The largest quantities of hazardous substances that the households are exposed to are included in the category "Harmful". This group include products that may cause damage because they contain solvents, substances with corrosive or irritating effects, etc. The consumption of such products in 2001 was 38 000 tonnes, an increase of 9 per cent in the three-year period from 1999. The data used for this indicator needs further development. |
|
|
9 |
Sources of income |
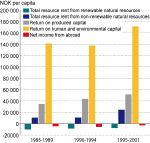
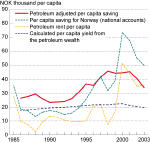
The net national income (NNI) may be considered the market-based yield of our national wealth. Variations in NNI over time may therefore be considered an indication of changes in the wealth. The indicator shows that human capital and environmental capital are of utmost importance for our economic welfare. The importance of the exploitation of non-renewable resources, mainly oil and gas, has increased strongly since 1985, and is now nearly half of the yield from produced assets. The resource rent from the primary industries, agriculture, forestry and fisheries, has been negative, mainly due to subsidies to agriculture. However, the size of the deficit has decreased in the period considered. |
|
|
10 |
Sustainable consumption |
Are we consuming too much? Or to be more precise: has the Norwegian population consumed more during one year than we have reason to believe can be sustained over time? If the answer is yes, the consumption may be characterised as not sustainable. The indicator "Petroleum adjusted savings" is meant to illustrate this issue, even though several important aspects of consumption are not included. The petroleum adjusted savings has been positive in the whole period considered. The level of consumption in Norway may therefore be characterised as sustainable, at least seen from a national perspective. |
|
|
11 |
Level of education |
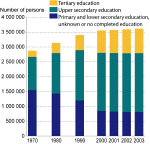
Human capital is a component of national wealth with significant contribution to the economic growth. The population's level of education may be considered as an indicator of the supply of qualified labour for the public and private sectors. OECD points out in the report "The Well-being of Nations" that "Education, training and learning can play important roles in providing the basis for economic growth, social cohesion and personal development". The level of education of the Norwegian population has increased considerably over the last 30 years. In 1970 about 7 per cent of the population had an education at the university level (tertiary education). In 2003, this number had increased to 23 per cent - an increase of 16 percentage points during the last 33 years. The last 20 years of the period (1983-2003) the number of people with a PhD-degree has increased by 286 per cent (from 3 550 to 13 750 persons). In the other end of the scale, the share of people with only primary and lower secondary education has decreased by over 30 percentage points since 1970. |
|
|
12 |
Sustainable public finances |
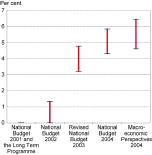
The public sector plays an important role for the total welfare, by using policy to influence the economic activity in the private sector, producing basic services within education, providing health and social care, etc., and by maintaining a comprehensive social security system. The expenses for these systems must, over time, be financed within the limits of the total public income. The generational accounts is a calculation of whether today's financial policy is sustainable in the long-term. If this is to be the case, public sector expenses must, over time, balance public sector income. The calculated need for tightening of public finances, as estimated in the generational accounts, has increased over time, partly as a result of altered assumptions concerning the development of life expectancy. The latest estimates of the need for tightening of public finances are in the range NOK 75-105 billion (cf. Macroeconomic Perspectives 2004). This is between 5 and 6 per cent of GDP for 2004. |
|
|
13 |
Health and welfare |
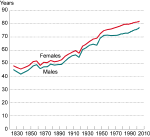
We live longer than ever before. Life expectancy in Norway has increased for nearly two hundred years. Newborn boys may expect to live until they are about 77 years old and newborn girls almost 82 years - the highest figures ever for Norway. Population projections from Statistics Norway indicate that the Norwegian population will on average be older, almost no matter what assumptions are made. Norway will therefore have a permanently higher share of older people and higher pension and social security responsibilities than today. This cannot be avoided by, for example, an increase in fertility or increased immigration within realistic levels. |
|
|
14 |
Exclusion from the labour market |
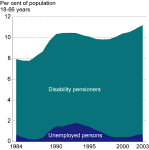
For most people, employment is an important part of social life and important for a feeling of well-being and the feeling of being included and appreciated. This is true although in Norway there are rather well established social security arrangements for those that for different reasons are excluded from the labour market. To be excluded from the labour market for a longer period may make it difficult to re-enter due to loss of qualification, experience, etc. In the economic recession at the beginning of the 1990s a rather high percentage were excluded from the labour market. This applied to both long-term unemployed persons and disability pensioners. After a passing decrease, the percentage has increased again to 11 per cent of the population in 2003. |
|
|
15 |
Global poverty reduction |
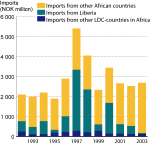
Important international challenges concerning global sustainable development are related to environmental problems and poverty reduction. In the UN's Millennium Goals, adopted in year 2000, the most important target is the reduction of global poverty. According to calculations by the World Bank, economic growth is shown to be vital for poverty reduction. To give the developing countries the possibility to sell their goods and services to industrialized countries on the same terms as other countries is an important measure that may contribute to economic development in these countries. Economic and technical assistance, better education and improved health conditions are also important. Import from Africa constitutes only a small percentage of total import to Norway. There was a modest increase in import in the mid 1990s but even then import from Africa was only 2 per cent of total import. Later, the import from Africa has fallen to under 1 per cent of total Norwegian import, with a value of NOK 2.7 billion in 2003. In 2003, import from the least developed countries (LDC) in Africa constituted just below 0.1 per cent of total import, the lowest level for more than 10 years. Liberia is classified as a LDC-country. The Norwegian trade with African LDC-countries has been dominated by import of used ships from this country and must be seen in connection with Norwegian shipowners' use of the international ship's register in Liberia. If we disregard this, the import from the other 32 LDC-countries in Africa has been very modest and rather stable in the whole period. Import in 2003 was 0.04 per cent of total import, and is dominated by flowers and ore. |
|
|
16 |
Global poverty reduction |
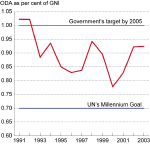
The effect of development assistance on poverty reduction and economic development is a much discussed topic. However, the predominant viewpoint seems to be that development assistance is effective, but only under certain conditions. Assistance seems to have a poverty reducing effect in countries with a stable economic policy, well-established institutions and a high level of poverty. Internationally, according to UN's Millennium Goals, the donor countries should contribute 0.7 per cent of gross national income (GNI) to official development assistance (ODA). The Norwegian government's goal is 1 per cent. In 2002 and 2003, Norway gave over 0.9 per cent of gross national income as official development assistance. |
See also: NOU 2005:5 Simple signals in a complex world.
Contact
-
Statistics Norway's Information Centre

