Holiday houses more clustered
Published:
Updated:
There are 464 000 holiday houses in Norway. Solitary holiday houses still make up the largest group, but will soon be surpassed by holiday houses that are situated within densely built-up holiday house areas.
- Full set of figures
- Holiday house areas
- Series archive
- Holiday house areas (archive)
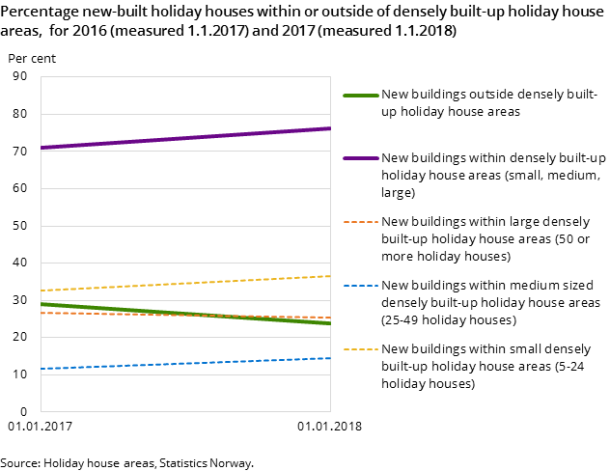
In 2016 and 2017, approximately 10 000 New holiday houses were built. More than three-quarters of these were built within densely built-up holiday house areas, with less than 75 metres to the nearest neighbour. The remaining quarter were built as solitary buildings or within a group of less than five holiday houses. This ‘scattered’ group is still most numerous (51 per cent), but the trend is towards greater clustering. Seven out of 10 holiday houses built in 2016 were erected within densely built-up holiday house areas, and this figure rose to 7.5 in 2017.
Holiday houses usually built within large holiday house areas
Building activity in 2017 was greatest in the large densely built-upholiday house areas, with 50 or more holiday houses. This means there is a greater clustering of holiday houses. As figure 1 shows, the share of holiday houses built in large holiday house areas has risen from 33 to 36 per cent from 2016 to 2017. In comparison, the share for the smallest holiday house areas (5-24 holiday houses) has decreased, from 27 to 25 per cent. The share for the medium-sized areas (25-49 holiday houses) has also risen, but is still the category with fewest new holiday houses.
Major disparities between the counties
Trøndelag, Oppland and Buskerud are the counties in Norway with the largest number of holiday houses, with 11, 11 and 10 per cent of Norway’s holiday houses respectively. Holiday house areas such as Oppdal, Hafjell, Valdres, Norefjell, Hemsedal and Geilo, which are all well known to Norwegians, are situated in these counties.¹
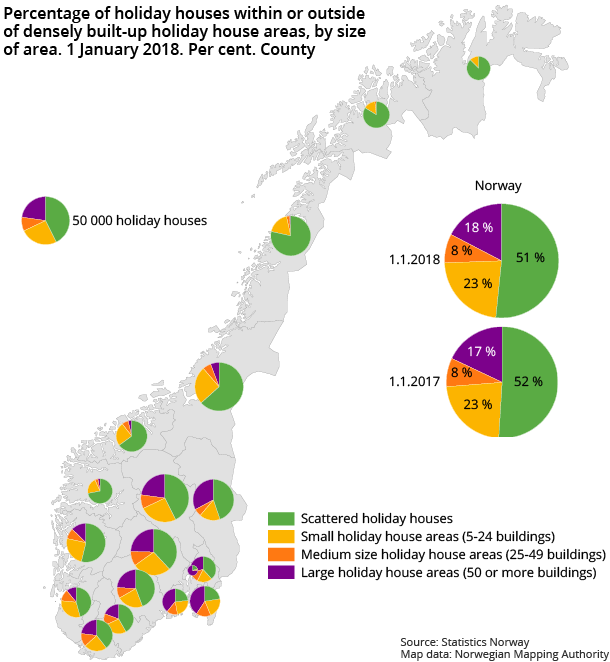
The number of holiday houses in the counties varies considerably, as does the structure of holiday house areas. While a typical holiday house in the county of Finnmark is either solitary or in a group with less than 5 holiday houses, its equivalent in the county of Oppland is more likely to be within a densely built-up holiday house area. This disparity can be seen in the map below, which distributes holiday houses into four categories: holiday houses situated outside densely built-up holiday house areas (scattered), and three categories for those within such areas, broken down into small-, medium- and large-sized areas.
In the counties of Østfold, Oslo and Vestfold, all within the Oslo fjord region, approximately 80 per cent of holiday houses are situated within densely built-up holiday house areas. Corresponding figures for Norway’s most northern counties are 15 to 20 per cent.
The most northern county in Norway is Finnmark. It is the county with the greatest proportion of holiday houses outside densely built-up holiday house areas, at 87 per cent.
Most new holiday houses in Oppland and Buskerud
Of the 10 000 new holiday houses built in 2016 and 2017, most were erected in the counties of Oppland and Buskerud. The growth rate in these counties was also relatively large. Their share of all existing holiday houses in Norway is 20 per cent, while their share of Norway’s new-build holiday houses in 2017 was nearly twice as much, at 35 per cent.
Building activity between counties varies considerably, as figure 3 shows for 2016 and 2017. The lowest level of building activity has been in the counties in the Oslo fjord region and in the most northern counties.
Figure 3.New-built holiday houses during 2016 (1.1.2017) and 2017 (1.1.2018). County
| 01.01.2017 | 01.01.2018 | |
| Oslo | 1 | 1 |
| Finnmark Finnmárku | 80 | 51 |
| Akershus | 46 | 52 |
| Vestfold | 67 | 76 |
| Østfold | 96 | 96 |
| Sogn og Fjordane | 102 | 118 |
| Troms Romsa | 102 | 120 |
| Aust-Agder | 152 | 179 |
| Møre og Romsdal | 190 | 182 |
| Nordland | 212 | 189 |
| Rogaland | 142 | 190 |
| Hordaland | 239 | 242 |
| Vest-Agder | 221 | 263 |
| Telemark | 431 | 472 |
| Trøndelag | 514 | 476 |
| Hedmark | 451 | 505 |
| Buskerud | 722 | 824 |
| Oppland | 856 | 913 |
Largest densely built-up holiday house area is at Sjusjøen
There are 13 477 densely built-up holiday house areas with at least 5 buildings. The surface area covered by these areas amounts to 408 km2. By comparison, Norway’s largest lake, Mjøsa, has a surface area of 370 km2, while the municipality of Oslo has a surface area of 454 km2.
Large densely built-up holiday house areas with 50 or more buildings now cover an area that amounts to 157 km2. This is 23.5 per cent of the total area covered by densely built-up holiday house areas, a rise of 1.5 per cent from 1 January 2017 to 1 January 2018. The largest densely built-up holiday house area encompasses the well-known lake Sjusjøen area. It is mainly situated in the municipality of Ringsaker (in the county of Hedmark), measures 4.5 km2 , and consists of 2 100 holiday houses.
¹ Corrected at 08.30 pm on 4 December 2018.
Contact
-
Svein Johan Reid
-
Statistics Norway's Information Centre


