Natural Resources and the Environment 2005 - Norway
Environmental pressure increasing - better pollution control
Published:
Overall pressure on natural resources and the environment is increasing as a result of economic growth and rising consumption. But we are increasingly able to limit the environmental pressures caused by economic activity.
In recent decades, technological progress has helped to limit various environmental pressures caused by economic activity in spite of a substantial growth in production and consumption. The most optimistic view is that economic growth can continue without major environmental costs, mainly thanks to technological advances. But there are also fears that the growth in consumption and production may cause the collapse of ecosystems. Statistics and analyses from Statistics Norway do not give a clear answer to which of these scenarios we may expect.
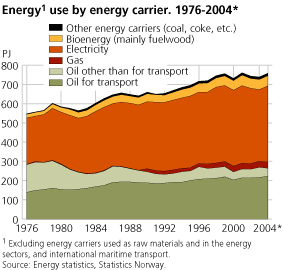
Rise in energy use
Energy is often considered the driving force for economic activity and growth. However, it is also the most important source of air pollution. In 2004, total energy use( 1 ) in Norway was 880 petajoules (PJ), an increase of 2.8 per cent from 2003. On average, energy use has increased by 1.3 per cent per year since 1976. In the same period, average annual economic growth, measured as gross domestic product, was 2.4 per cent. In 2004, electricity accounted for about half of total energy use, and oil for transport for 29 per cent. Oil for transport now accounts for 82 per cent of total oil consumption. In 2004, total energy use in Norway was equivalent to about 11 per cent of the total extraction of energy commodities. Oil and gas accounted for 95 per cent of total extraction of energy commodities.
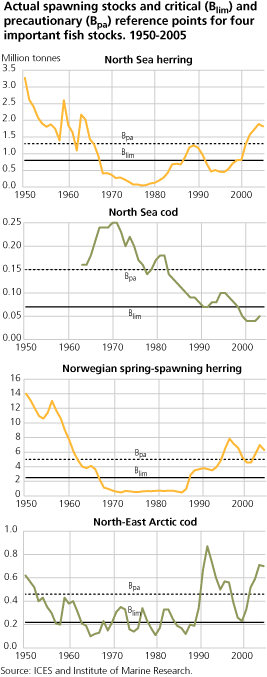
Fish resources still under considerable pressure
Technological progress has not only reduced the adverse environmental impacts of economic activity, but also made it possible to harvest natural resources more efficiently. Trends in the size of fish stocks in Norwegian waters illustrate how technological progress, in this case in the form of more efficient fishing vessels and fishing methods, has increased the pressure on some natural resources. However, it is important to be aware that there are considerable natural fluctuations in the size of fish stocks. These may be caused by interactions between species, changes in water temperature, etc.
Since the 1950s, several fish stocks in Norwegian waters areas have declined considerably. The stocks most seriously affected are demersal species such as cod, Norway pout and sandeel in the North Sea, and redfish, Greenland halibut and Barents Sea capelin in the Barents Sea-Norwegian Sea area. The size of the coastal cod stock has declined from about 300 000 tonnes in 1994 to 60 000 tonnes in 2005. However, since the end of the 1980s, the situation has improved for certain important fish stocks such as North Sea herring, Norwegian spring-spawning herring and Northeast Arctic cod.
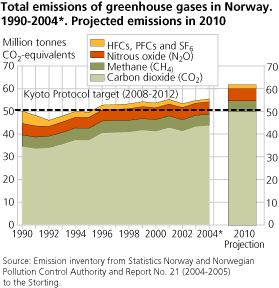
Rising emissions of greenhouse gases
The Kyoto Protocol entered into force on 16 February 2005. According to the Protocol, Norwegian greenhouse gas emissions may not be more than 1 per cent higher than the 1990 level in the period 2008-2012( 2 ). However, these emissions rose by 1 per cent( 3 ) from 2003 to 2004, and preliminary calculations from 2005 show that they were 11 per cent above the 1990 level in 2004. In 2004, CO 2 accounted for almost 80 per cent of Norway's aggregate greenhouse gas emissions. Oil and gas extraction accounted for 28 per cent of CO 2 emissions, and road traffic for 22 per cent. Total emissions of greenhouse gases from oil- and gas-related activities increased by 77 per cent in the period 1990-2004, while emissions from road traffic increased by 34 per.
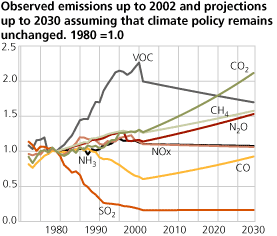
Projections of emissions up to 2030 indicate that emissions of most local or regional pollutants will level off or drop despite continued economic growth if today's environmental policy is maintained. Environmental policy, technological developments and the relative size of production sectors will all play a part in limiting emissions. However, the projections indicate that emissions of the greenhouse gas CO 2 will increase substantially in the period up to 2030.
More waste
The general pattern of increasing overall environmental pressure combined with a reduction of pollution relative to economic activity (lower pollution intensity) is also apparent for waste generation and management. In 2004, a total of 8.6 million tonnes of waste was generated in Norway. Of this, 820 000 tonnes was classified as hazardous waste. Since 1995 the total quantity of waste generated has increased by 22 per cent. Household waste generation is increasing most rapidly. In 2004, per capita generation of household waste was 378 kg, 13 kg more than the year before. An increasing proportion of the waste is collected for energy or material recovery. In 2004, 49 per cent of household waste was recovered.
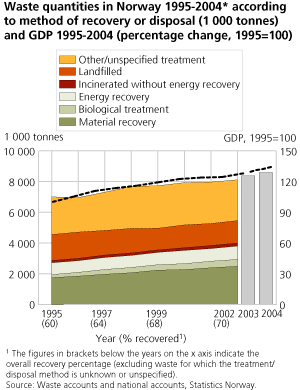

Projections of waste quantities, partly based on prognoses for economic development, indicate that waste generation will total 9 million tonnes in 2007. The projections also indicate that household waste generation will continue to increase most steeply, and will account for 24 per cent of total waste in 2010, as against 22 per cent in 2004.
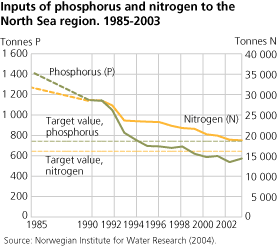
Inputs of nutrients to coastal waters rising, but less to the North Sea
From 2000 to 2003, total anthropogenic inputs of phosphorus and nitrogen to the Norwegian coast increased by 10 and 25 per cent respectively. The fish farming industry accounted for 73 per cent of phosphorus inputs. Agriculture was the largest source of nitrogen inputs, and accounted for 39 per cent of the total. However, inputs of phosphorus and nitrogen to the North Sea region have been considerably reduced since 1985, by 62 and 42 per cent respectively. This is mainly a result of investments in more efficient waste water treatment plants. Measures have also been implemented in fish farming and the agricultural sector. Since 1997, open fish farming facilities have been prohibited in the North Sea region.
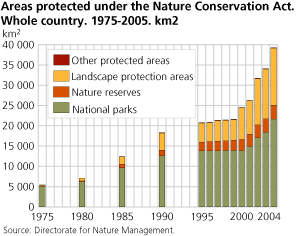
Area under protection increasing
One important way of reducing the pressure on the environment and natural resources is to give areas some form of protection. The total area protected under the Nature Conservation Act was increased by 15 per cent from 2003 to 2004, and is now equivalent to 12.1 per cent of the total area of Norway. The protected areas include national parks (55 per cent of total area protected), nature reserves (9 per cent), protected landscapes (36 per cent) and other types of protected areas (0.3 per cent). Apart from safeguarding outdoor recreation areas, one of the most important objectives of area protection is to maintain biological diversity by protecting the habitats of animals and plants.
Sustainable development?
It is difficult to give a clear overall picture of the state of the environment. This means that it is largely left to different stakeholders to evaluate the overall situation. Their conclusions will depend on the weight they give to different aspects of the state of the environment, although it is clear that some are more generally important than others. It is even more difficult to give real substance to the concept of sustainable development. To make an overall evaluation of whether development is sustainable, it is necessary to have access to key information on those areas that are most important for the quality of people’s lives and their welfare in the long term.
A set of sustainable development indicators for Norway is being established as a means of obtaining this information. Last year, an expert committee appointed by the Norwegian government proposed a set of 16 indicators ( NOU 2005:5 ). They include environmental state and pressure indicators and indicators of trends in economic and social conditions of key importance to our welfare. The indicator set is presented in this year's edition of Natural Resources and the Environment .
(1) Use of energy commodities outside the energy sectors and international maritime transport. Includes energy commodities used as raw materials.
(2) After emissions trading and other mechanisms for reducing emissions have been taken into account.
(3) According to new, revised figures published on 9 February 2006 (after the editing of Natural Resources and the Environment 2005 was completed), Norwegian greenhouse gas emissions in 2004 were 10 per cent above the 1990 level, and the increase from 2003 to 2004 was 1 per cent. http://www.ssb.no/english/subjects/01/04/10/klimagassn_en/
Contact
-
Statistics Norway's Information Centre