Emissions from Norwegian economic activity, 1990-2015
Published:
In 2015, greenhouse gas emissions per produced NOK were at about the same level as the previous year. 2015 is the first year since 2010 that the emission intensities have not decreased.
- Full set of figures
- Emissions from Norwegian economic activity
- Series archive
- Emissions from Norwegian economic activity (archive)
The emission intensity for greenhouse gases was 14.6 tonnes of CO2-equivalent per million produced in 2015. This is a 0.3 per cent increase compared to 2014, and the first year since 2010 that the emission intensities have not decreased. This is mainly due to an increase in the production in 2015 combined with an increase in emissions of greenhouse gases.
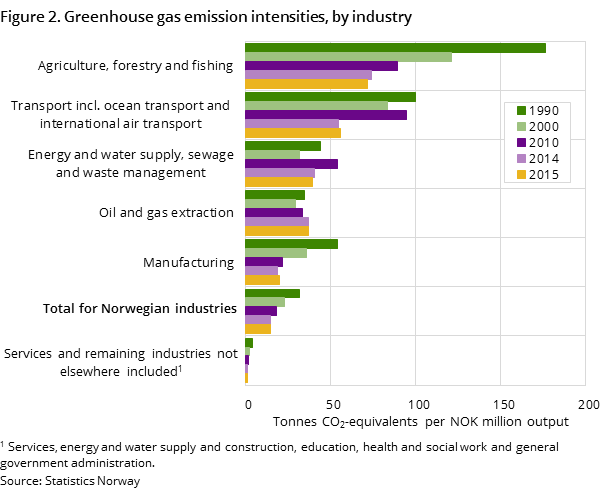
The decrease in the emission intensity for greenhouse gases before 2014 has mainly been attributed to a relatively strong economic growth in the less emission-intensive service industries compared to other industries. Since 2010, the decline in the emission intensity in the Norwegian manufacturing industries, maritime transport and the primary industries have also contributed to the decline in green greenhouse gas emissions per produced NOK for the Norwegian economy as a whole. In 2015, the emission intensity for greenhouse gases in both the manufacturing industries and the ocean transport increased. After annual increases in the emission intensity for greenhouse gases for the oil and gas extraction industries, there were no changes from 2014 to 2015.
Weak production growth and increased greenhouse gas emissions
The 1.5 per cent production growth in the Norwegian economy in 2015 (measured in fixed 2005 prices) for the Norwegian economy as a whole was the smallest growth in production since 2010. The weak production growth was mainly due to a decrease in the production in the manufacturing industries and a weak growth in the service sectors. The growth in the production in the oil and gas extraction industries pulled in the opposite direction.
There is not necessarily a direct correlation between growth in production and increased emissions of greenhouse gases.
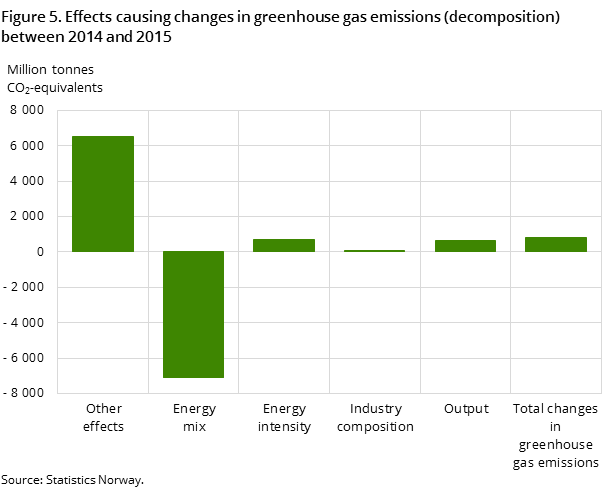
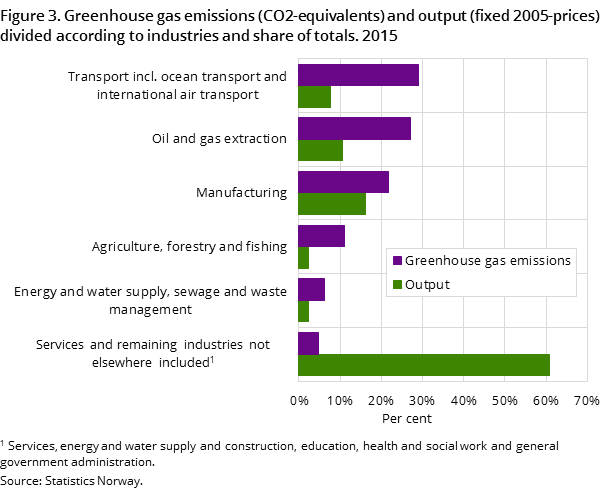
The greenhouse gas emissions (measured in CO2 equivalents) related to this economic activity increased by 0.5 per cent, totalling 55.9 million tonnes of CO2 equivalents. This is the first time since 2010 that these greenhouse gases have increased. The increase in emissions from the manufacturing industries and the oil and gas extraction industries made a particular contribution to the total increase in greenhouse gas emissions.
The emission intensities in the manufacturing industries increases
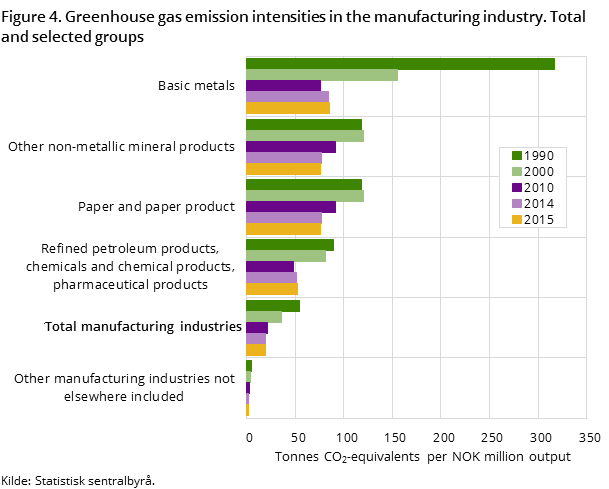
From 2014 to 2015, greenhouse gas emissions per produced NOK in the manufacturing industries increased by 4.5 per cent. After four consecutive years of annual decline in greenhouse gas emissions, concurrent with increases in production, this trend was broken in 2015 for the manufacturing industry as a whole. The increase in the emission intensity for the manufacturing industries was mainly due to a decline in the production in the less emission-intensive manufacturing industries combined with an increase in the emission intensity for the refined petroleum, chemical and pharmaceutical products and the production of metals.
In 2015, the increase in production in refined petroleum, chemical and pharmaceutical (9 per cent) was less than the increase in emission of greenhouse gases (10 per cent). Even though the emission of greenhouse gases from the production of metals decreased (by 3 per cent), the production decreased even more (by 5 per cent). The emissions of greenhouse gases in the manufacturing industries are heavily influenced by the development in the refined petroleum, chemical and pharmaceutical products and the production of metals, which together account for more than 2/3 of the total emissions from the manufacturing industries.
Zero growth in emissions intensity for the oil and gas extraction industries
After five years of annual increase in emissions of greenhouse gases per produced NOK in oil and gas production, there was no change in 2015 from the previous year. Emissions of greenhouse gases from the oil and gas extraction industries increased also in 2015, but unlike previous years this was combined with a relatively strong growth in production. Both emissions of greenhouse gases and the production (measured in fixed 2005 prices) in the oil and gas extraction industries increased by 4 per cent in 2015.
Large variations between the transport industries
The picture for the transport sector is complex. The transport sector contains different transport industries with large variations in both the level and development of their emission intensities. In 2015, the emission intensity for greenhouse gases decreased in both land transport and coastal sea transport, but for different reasons. While land transport for the first time since 2011 has a stronger growth in production than in emissions of greenhouse gases, both production (-1.3) and emissions to air (-5) decreased in coastal sea transport. The emission intensity for greenhouse gases increased both in air transport and in ocean transport.
Contact
-
Kristine Erlandsen Kolshus
-
Henning Høie
-
Knut Sørensen
-
Statistics Norway's Information Centre

![Figure 1. Total greenhouse gas emissions (CO2-equivalents], output (fixed 2005-prices] and emission intensity for Norwegian economic activity (excl. households) Figure 1. Total greenhouse gas emissions (CO2-equivalents], output (fixed 2005-prices] and emission intensity for Norwegian economic activity (excl. households)](/en/natur-og-miljo/artikler-og-publikasjoner/_image/287477.png?_encoded=2f66666666666678302f35382f29303136286874646977656c616373&_ts=158dd75d9b0)


