Content
Published:
This is an archived release.
Higher GDP
The Norwegian total economy had stronger growth in 2010 than previously estimated. According to revised national accounts, GDP grew by 0.7 per cent in 2010; an upward revision of 0.4 per cent. Statistics Norway has also carried out a main revision of the national accounts dating back to 1970, the results of which have now been released.
The main reason for this is an adaption to the new industrial classification SIC2007, based on the EU’s new classification NACE rev.2. In addition, new data and results from new estimations for some areas have been included from the year 2002 and onwards. This applies in particular to the dwelling industry, property development, exports and imports of services and unregistered and illegal activities.
The national accounts data up to 2009 are now regarded as final, while the 2010 data are still preliminary.
Stronger growth in GDP in 2010, weaker in 2008 and unchanged in 2009
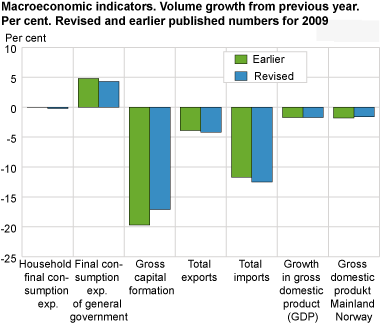
The revision of the 2010 GDP volume growth rate is due to new information on the oil and ocean transport activities. The growth in GDP Mainland Norway is estimated at 1.9 per cent, which is revised down 0.2 percentage points. Consumption expenditures in households and non-profit organisations are revised slightly upwards, while government consumption expenditures have been revised down. The fall in fixed capital formation has been moderated somewhat, and exports and imports of goods and services have both been revised up.
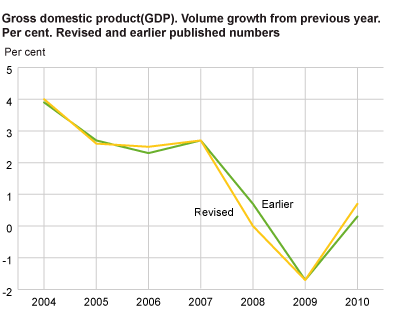
2009 was the first year since 1988 that the Norwegian total economy shrunk compared to the previous year. GDP went down -1.7 per cent according to the final national accounts data; the same rate as the last publication. The activity both in Mainland Norway and in the offshore industries slowed down by -1.6 and -1.8 per cent respectively.
For the year 2008, the growth in GDP has been revised down 0.7 percentage points and according to a final estimation was unchanged compared to the previous year. Growth in GDP Mainland Norway has been revised down from 1.8 per cent to 1.5 per cent, while the offshore activities now show a more negative development.
Employment data have also been revised. Measured as work-hours, the growth in 2008 has not been revised; it remains at 3.5 per cent, while 2009 now shows a reduction of -1.7 per cent compared to -1.8 per cent estimated before. For 2010, the employment has been revised up to 0.8 per cent.
Minor revision in backwards GDP growth rates
For all years up to and including 2001, the revision deals exclusively with reallocation between industries, and no aggregates have been changed. As from 2002, some additional data revisions have been done in certain areas. The revisions in GDP growth rates are however quite moderate. For 2004 and 2006, the GDP growth rates have been adjusted up 0.1 and 0.2 percentage points respectively, while in 2005 they were revised down 0.1 percentage point. The 2003 and 2007 GDP growth rates have not been changed compared to earlier publications.
Higher GDP levels
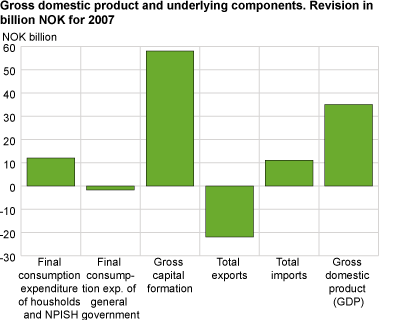
The main revision has caused an increase in the level of GDP measured in current Norwegian kroner (NOK) for all years since 2003. In the following, the revision is illustrated using 2007 figures.
GDP in 2007 is now estimated at NOK 2 306 billion, which represents an upward revision of NOK 35 billion or 1.5 per cent. New estimations of dwelling services have, together with new information on some other consumption categories, increased the consumption expenditures of households. Gross fixed capital formation in property development activities and dwellings is the main explanation for the upward revision in total gross fixed capital formation. Changes in stocks now amount to a larger share of total gross capital formation compared to earlier estimates.
Exports of goods and services are revised down by NOK 22 billion, while imports are revised up by NOK 10 billion. The trade balance is therefore revised down by NOK 32 billion, bringing the figure for 2007 to NOK 316 billion or 14 per cent of GDP.
More on the main revision
The new industry classification has been applied dating back to 1970 by reallocating producing units according to the new standard. This means that the national accounts now present comparable figures for manufacturing and other industries covering a 40-year period. It is important to realise that the introduction of the new classification into the national accounts per se do not change the main economic aggregates, i.e. GDP and its components, or the levels or the growth rates.
The property development industry has been subject to thorough and deep analysis of both data sources and estimation methods. The results are both a revision of the total activity and also a reallocation towards the construction industries. The output and value added figures and the gross fixed capital formation figures in the dwelling industry have also been revised.
According to recognised international recommendations, the national accounts are to cover all economic activities, regardless of their legal status or whether they are registered or not (“black economy”). Statistics Norway recently carried out estimations on prostitution, drug dealing and smuggling of liquor. The estimates are included in the national accounts from 2002 onwards. The total level of illegal consumption is estimated at NOK 2.2 billion for 2007, or 0.2 per cent of household’s total final consumption. Legal but non-registered activities have also been estimated for certain industries.
Exports and imports of services have been revised by introducing levels from Statistic Norway’s new sample survey of international trade in services. Until now, only the development in these transactions has been used in estimating the services trade in the national accounts and balance of payments. 2007 was the first year with the new statistics supplying grossed up figures and the time series have been smoothed back to 2004; the last year with figures from the old source data from the central bank’s settlement statistics.
The employment data and data on compensation of employees of the national accounts have also been revised, primarily by linking the estimations closer to register data. Time series have been revised dating back to 2002.
Statistic Norway's revised national accounts are available as of 22 November. Links include National Accounts :
National accounts, annual final national accounts 1970-2009 and preliminary national accounts 2010 , National accounts, Institutional Sector Accounts for 2009 and preliminary accounts 2010 , Quarterly national accounts for third quarter of 2011 .
For more details see StatBank .
The statistics is now published as National accounts.
Additional information
Special tables for experienced users:
Contact
-
Statistics Norway's Information Centre
E-mail: informasjon@ssb.no
tel.: (+47) 21 09 46 42


