Content
Published:
This is an archived release.
GDP level lifted 0.8 per cent
The Norwegian National Accounts has been revised back to 1970. As a result, the level of GDP at current prices has risen 0.8 per cent on average. The year-to-year growth rates of GDP at constant prices have also been revised.
The main reason for revising the time series has been to adapt to international recommendations for the treatment of financial intermediation services and value added taxes (VAT). For the most recent years, other items have also been recalculated.
Stronger GDP growth in 2004 and 2005
The National Accounts figures up to and including 2004 are now final, while the figures for 2005 are still preliminary.
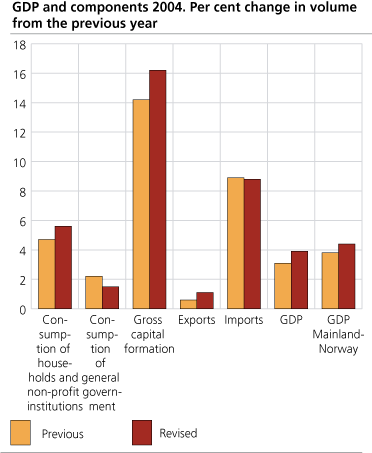
The final figures for 2004 show a stronger volume growth in the GDP than earlier presented, being revised up from 3.1 per cent to 3.9 per cent. For Mainland-Norway, the growth has been revised up from 3.8 per cent to 4.4 per cent. Household consumption, gross fixed capital consumption and exports of goods and services show a stronger growth, while general government consumption and imports show a slower growth according to the revised figures compared to the previous ones.
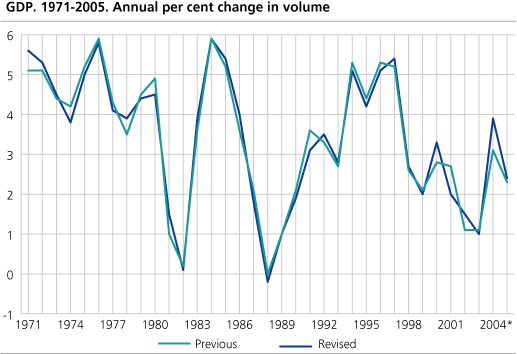
According to the new preliminary figures of 2005, GDP measured at constant prices was 2.4 per cent higher compared to the previous year. The represents an upward adjustment of 0.1 percentage points from the previously published figure. GDP of Mainland-Norway has however been revised somewhat more, from 3.7 per cent to 4.1 per cent. The growth in some services industries, power supply, fisheries and general government has all been revised upwards.
Revisions in time series of GDP growth rates
Prior to year 2000 the revisions comprise, with some exceptions, exclusively the new treatment of financial services and the measurement of value added tax. For most years the revision of the GDP growth rate varies between 0 and +/- 0.2 percentage points. Maximum revision of the annual growth rate for this period is 0.5 percentage points.
GDP level lifted
For all years GDP at current prices is revised upwards. On average the GDP level is lifted 0.8 per cent. The largest revision occurs for 1986 and 1987 with an upward revision of the GDP level of 1.6 per cent.
As an illustration of the effects of the revisions, the year 2003 is described more in detail below.
The 2003 GDP has been revised up NOK 17 billion to NOK 1 594 billion or 1.1 per cent. The new treatment of financial intermediation services can explain almost three quarters of the total revision. The financial consumption expenditures of households are now NOK 19 billion above the previous estimate of which two thirds is due to the consumption of financial services. The remaining is due to a revision of the consumption of both owner occupied dwellings services and the purchases of automobiles. The consumption expenditures of the general government have been revised up NOK 4 billion. Exports and imports have been revised up NOK 5 and NOK 10 billion respectively, more than a half due to the new recording of financial intermediation services. Gross fixed capital services are hardly revised at all.

Background for the revision A separate EEA regulation instructs the member countries to change the recording of financial intermediation services in the National Accounts. Most EEA countries introduced the new recording during 2005. Also the calculation of value added tax in the National Accounts has been changed due to new recommendations. To keep the consistency of the National Accounts' time series, a backward estimation to 1970 has been necessary. Another area under revision has been employment and compensation of employees. Here, a complete newly developed estimation system has been developed and introduced, giving rise to revisions in the historic time series. In addition, other elements are parts of the total revision. Particular this is the case for the most recent years, where among other things new estimations of the owner occupied dwelling services have been carried out and new information from local government sector has been included. |
New recording of Financial Intermediation Services Indirectly Measured (FISIM) FISIM represents a part of the services provided by financial institutions. There are mainly two types of services provided by these institutions. First, services for which fees are charged directly. Second, financial institutions also provide a service by channelling from holders of funds to those in need of them. The value of this service is represented by the difference between asset income (lending rates) and asset payments (deposit rates), but is not charged directly to those who benefit from the provision of the service. The value of this intermediation services therefore needs to be estimated indirectly. Previously, FISIM was recorded in the National Accounts as part of the production value of the financial institutions, while the uses of these services were not allocated to the actual consumers, but rather was recorded as intermediate consumption in a nominal industry. Hence, FISIM did not contribute to the overall GDP. Now these services are allocated to final consumption of households and non-profit institutions, general government, and exports, in addition to intermediate consumption of producers of goods and services, and therefore contribute to GDP. Imports of FISIM are also estimated. |
The statistics is now published as National accounts.
Additional information
Special tables for experienced users:
Contact
-
Statistics Norway's Information Centre
E-mail: informasjon@ssb.no
tel.: (+47) 21 09 46 42