Content
Published:
This is an archived release.
Steady savings in households
Households’ disposable income increased by 0.8 per cent from the 4th quarter of 2010 to the 1st quarter of 2011, and the savings were slightly higher than in the two previous quarters, according to seasonally-adjusted figures.
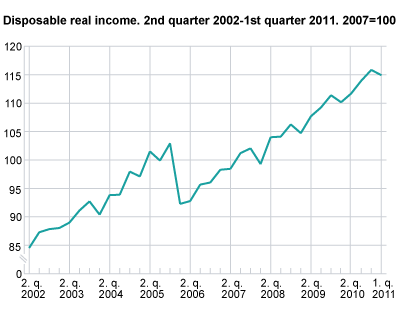
Behind the growth in disposable income is an increase in compensation of employees and in payments and benefits from the general government. However, higher property income paid as well as lower property income received contributed to soften the growth in disposable income.
Households’ savings, which is measured by the difference between disposable income and consumption expenditure, was almost NOK 36 billion in the 1st quarter of 2011. In comparison, the estimate for 2010 as a whole is NOK 86 billion. When adjusting for seasonal variations, the savings were slightly higher in the 1st quarter compared with the previous quarter.
See National accounts, sector accounts for more information on revisions of annual figures.
| 2008* | 2009* | 2010* | Real growth. Percentage2 | Contribution to growth on disposable real income. Percentage points |
|||||||||||||||||||||||||||||||||||||||||||||||||||||||||||||||||||||||||||
|---|---|---|---|---|---|---|---|---|---|---|---|---|---|---|---|---|---|---|---|---|---|---|---|---|---|---|---|---|---|---|---|---|---|---|---|---|---|---|---|---|---|---|---|---|---|---|---|---|---|---|---|---|---|---|---|---|---|---|---|---|---|---|---|---|---|---|---|---|---|---|---|---|---|---|---|---|---|---|---|
| 2008* | 2009* | 2010* | 2008* | 2009* | 2010* | ||||||||||||||||||||||||||||||||||||||||||||||||||||||||||||||||||||||||||
| Income | 1 460,1 | 1 504,3 | 1 582,1 | 5,2 | 0,5 | 3,2 | 7,6 | 0,7 | 4,5 | ||||||||||||||||||||||||||||||||||||||||||||||||||||||||||||||||||||||
| Compensation of employees | 857.0 | 884.0 | 919.5 | 5.3 | 0.6 | 2.0 | 4.5 | 0.5 | 1.7 | ||||||||||||||||||||||||||||||||||||||||||||||||||||||||||||||||||||||
| Mixed income | 110.9 | 111.7 | 121.1 | -1.3 | -1.7 | 6.3 | -0.1 | -0.2 | 0.7 | ||||||||||||||||||||||||||||||||||||||||||||||||||||||||||||||||||||||
| Property income received | 96.7 | 72.1 | 77.6 | 16.3 | -27.2 | 5.6 | 1.4 | -2.6 | 0.4 | ||||||||||||||||||||||||||||||||||||||||||||||||||||||||||||||||||||||
| Amount of which is due to dividends | 26.5 | 24.8 | 27.9 | 38.3 | -8.7 | 10.1 | 0.8 | -0.2 | 0.2 | ||||||||||||||||||||||||||||||||||||||||||||||||||||||||||||||||||||||
| Pensions and benefits from general government | 298.3 | 326.5 | 345.2 | 3.5 | 6.8 | 3.7 | 1.1 | 2.0 | 1.1 | ||||||||||||||||||||||||||||||||||||||||||||||||||||||||||||||||||||||
| Other income (net) | 56.2 | 60.9 | 68.2 | -0.3 | 5.6 | 9.8 | 0.0 | 0.3 | 0.6 | ||||||||||||||||||||||||||||||||||||||||||||||||||||||||||||||||||||||
| Correction for FISIM | 41.0 | 48.9 | 50.6 | 21.0 | 16.6 | 1.4 | 0.7 | 0.7 | 0.1 | ||||||||||||||||||||||||||||||||||||||||||||||||||||||||||||||||||||||
| Expenditures | 466.7 | 441.1 | 453.2 | 8.9 | -7.8 | 0.8 | -4.0 | 3.7 | -0.3 | ||||||||||||||||||||||||||||||||||||||||||||||||||||||||||||||||||||||
| Current taxes on income, wealth, etc. | 337.8 | 354.9 | 368.4 | 2.5 | 2.5 | 1.8 | -0.8 | -0.8 | -0.6 | ||||||||||||||||||||||||||||||||||||||||||||||||||||||||||||||||||||||
| Property income paid | 128.9 | 86.1 | 84.8 | 30.6 | -34.8 | -3.4 | -3.1 | 4.5 | 0.3 | ||||||||||||||||||||||||||||||||||||||||||||||||||||||||||||||||||||||
| Disposable income | 993.4 | 1 063.2 | 1 129.0 | 3.6 | 4.4 | 4.1 | . | . | . | ||||||||||||||||||||||||||||||||||||||||||||||||||||||||||||||||||||||
| 1 | The components do not sum up to the totals due to rounding. |
| 2 | National accounts price index for consumption by households and NPISHs is used as a deflator. |
RevisionsQuarterly sector accounts are based on preliminary calculations. The uncertainty in the last quarter is the largest. New information is continuously being integrated into the figures, which could cause revisions in the previously released data. Quarterly sector accounts are also consolidated against the data from the quarterly national accounts data. When the last quarters of the unadjusted series are updated, seasonally-adjusted series may also be revised backwards. |
Tables
Additional information
Contact
-
Pål Sletten
E-mail: pal.sletten@ssb.no
tel.: (+47) 99 29 06 84
-
Nils Amdal
E-mail: nils.amdal@ssb.no
tel.: (+47) 91 14 91 46