Content
Published:
This is an archived release.
Increased disposable income for households
Seasonally-adjusted figures for the 3rd quarter of 2010 show that disposable real income in the household sector increased by 1.8 per cent, while the savings were lower than in the previous quarter.
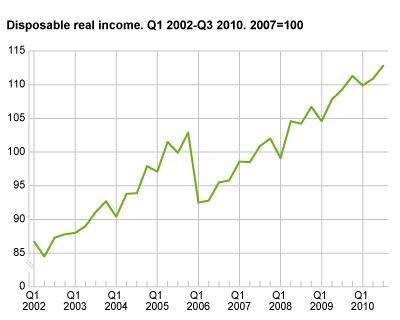
Disposable income, nominally measured and adjusted for seasonal variations, increased by 1.0 per cent from the 2nd to 3rd quarter. Compensation of employees went up by 1.6 per cent, and pensions and benefits from central government increased by 0.7 per cent. A decline in property income, on the other hand, contributed to soften the growth.
Growth in household consumption resulted in lower savings
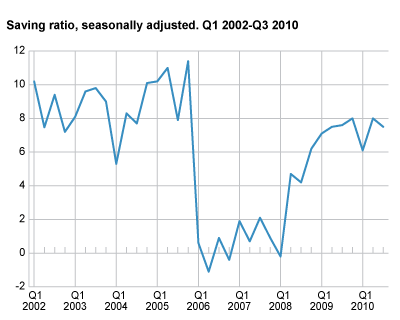
Household consumption went up by 1.6 per cent from the 2nd to 3rd quarter. This resulted in a reduction in net savings compared with the previous quarter. Savings amounted to NOK 21 billion, which is approximately 1 billion less than in the 2nd quarter. See here for more information on household consumption .
Lower saving rate
Without adjustments for seasonal variations, savings share of disposable income, the saving rate, was 6.1 per cent in the 3rd quarter, while the corresponding saving rate in the previous quarter was 8.5 per cent.
| Disposable income | Disposable real income | ||||||||||||||||||||||||||||||||||||||||||||||||||||||||||||||||||||||||||||||
|---|---|---|---|---|---|---|---|---|---|---|---|---|---|---|---|---|---|---|---|---|---|---|---|---|---|---|---|---|---|---|---|---|---|---|---|---|---|---|---|---|---|---|---|---|---|---|---|---|---|---|---|---|---|---|---|---|---|---|---|---|---|---|---|---|---|---|---|---|---|---|---|---|---|---|---|---|---|---|---|
| 1st quarter 2007 | 4.2 | 3.0 | |||||||||||||||||||||||||||||||||||||||||||||||||||||||||||||||||||||||||||||
| 2nd quarter 2007 | -0.2 | -0.2 | |||||||||||||||||||||||||||||||||||||||||||||||||||||||||||||||||||||||||||||
| 3rd quarter 2007 | 2.4 | 2.4 | |||||||||||||||||||||||||||||||||||||||||||||||||||||||||||||||||||||||||||||
| 4th quarter 2007 | 1.1 | 1.1 | |||||||||||||||||||||||||||||||||||||||||||||||||||||||||||||||||||||||||||||
| 1st quarter 2008 | 0.6 | -2.9 | |||||||||||||||||||||||||||||||||||||||||||||||||||||||||||||||||||||||||||||
| 2nd quarter 2008 | 5.6 | 5.6 | |||||||||||||||||||||||||||||||||||||||||||||||||||||||||||||||||||||||||||||
| 3rd quarter 2008 | -0.4 | -0.4 | |||||||||||||||||||||||||||||||||||||||||||||||||||||||||||||||||||||||||||||
| 4th quarter 2008 | 2.3 | 2.3 | |||||||||||||||||||||||||||||||||||||||||||||||||||||||||||||||||||||||||||||
| 1st quarter 2009 | 0.5 | -2.0 | |||||||||||||||||||||||||||||||||||||||||||||||||||||||||||||||||||||||||||||
| 2nd quarter 2009 | 3.1 | 3.1 | |||||||||||||||||||||||||||||||||||||||||||||||||||||||||||||||||||||||||||||
| 3rd quarter 2009 | 1.4 | 1.4 | |||||||||||||||||||||||||||||||||||||||||||||||||||||||||||||||||||||||||||||
| 4th quarter 2009 | 1.9 | 1.9 | |||||||||||||||||||||||||||||||||||||||||||||||||||||||||||||||||||||||||||||
| 1st quarter 2010 | 0.6 | -1.3 | |||||||||||||||||||||||||||||||||||||||||||||||||||||||||||||||||||||||||||||
| 2nd quarter 2010 | 1.0 | 0.9 | |||||||||||||||||||||||||||||||||||||||||||||||||||||||||||||||||||||||||||||
| 3rd quarter 2010 | 1.0 | 1.8 | |||||||||||||||||||||||||||||||||||||||||||||||||||||||||||||||||||||||||||||
RevisionsQuarterly sector accounts are based on preliminary calculations. The uncertainty in the last quarter is the largest. New information is continuously being integrated into the figures, which could cause revisions in the previously released data. Quarterly sector accounts are also consolidated against the data from the quarterly national accounts data. When the last quarters of the unadjusted series are updated, seasonally-adjusted series may also be revised backwards. |
Tables
Additional information
Contact
-
Pål Sletten
E-mail: pal.sletten@ssb.no
tel.: (+47) 99 29 06 84
-
Nils Amdal
E-mail: nils.amdal@ssb.no
tel.: (+47) 91 14 91 46