Content
Published:
This is an archived release.
Increase in the real disposable income
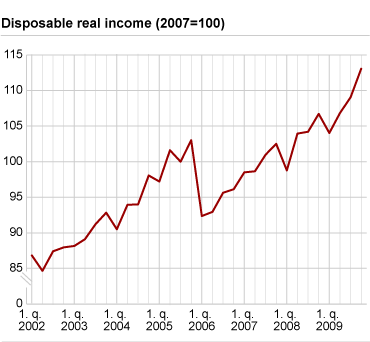
Households' and NPISHs' real disposable income increased by 3.7 per cent from the 3rd to the 4th quarter in 2009. The annual increase in the real disposable income was 4.8 percent.
Disposable income for the households' increased nominally by 7.4 per cent from 2008 to 2009. During last year, a continuous upward movement in the disposable income has been recorded and from the 3rd to the 4th quarter of 2009 the disposable income increased by 3.7 per cent. The main income source for the households, compensation of employees, showed a slight increase during the 2009. Wage incomes corrected by the consumption deflator, contributed the rise in real disposable income, by 0.5 per cent at the annual level.
Increase in unemployment benefits and sick-leave compensation
Pensions and benefits from the general government increased by 9.4 per cent from 2008 to 2009. Seasonally adjusted figures show a quarterly increase of 1.9 per cent for the last quarter of 2009.
Lower interest rates pushed the disposable income up
The turmoil in the financial markets continued in 2009 and interest rates for this year constituted slightly under half of their corresponding level in 2008. Property income, composed of earnings through dividends and interest rates, fell by almost 30 per cent in comparison to 2008. Property income paid comprises entirely of interest rates paid for loans. Therefore, lower interest rates resulted in a decrease in these expenses for the households, of NOK 47 billion compared to the year before. The decrease in the interest rates paid was 20 per cent from the 3rd to the 4th quarter in 2009. The interests paid are still higher than the interests earned and hence, the reduced strain to the households contributed to almost half of the increase in the disposable real income in 2009.
Higher savings
Savings - defined as disposable income minus final consumption expenditure and corrected -
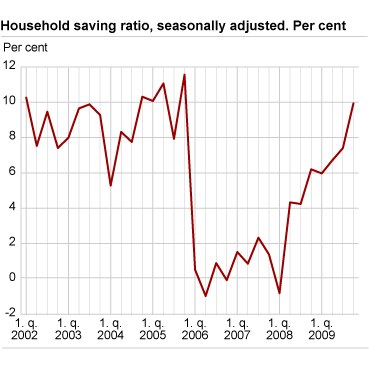
amounted to almost NOK 80 billion in 2009. The seasonally-adjusted figures show that savings increased all through 2009. Savings ratio was 7.5 per cent as opposed to 3.4 per cent in 2008.
| Disposable income |
Disposable income |
Household saving ratio |
|||||||||||||||||||||||||||||||||||||||||||||||||||||||||||||||||||||||||||||
|---|---|---|---|---|---|---|---|---|---|---|---|---|---|---|---|---|---|---|---|---|---|---|---|---|---|---|---|---|---|---|---|---|---|---|---|---|---|---|---|---|---|---|---|---|---|---|---|---|---|---|---|---|---|---|---|---|---|---|---|---|---|---|---|---|---|---|---|---|---|---|---|---|---|---|---|---|---|---|---|
| 1st quarter 2007 | 3.7 | 2.5 | 1.5 | ||||||||||||||||||||||||||||||||||||||||||||||||||||||||||||||||||||||||||||
| 2nd quarter 2007 | 0.2 | 0.2 | 0.8 | ||||||||||||||||||||||||||||||||||||||||||||||||||||||||||||||||||||||||||||
| 3rd quarter 2007 | 2.4 | 2.4 | 2.3 | ||||||||||||||||||||||||||||||||||||||||||||||||||||||||||||||||||||||||||||
| 4th quarter 2007 | 1.5 | 1.5 | 1.3 | ||||||||||||||||||||||||||||||||||||||||||||||||||||||||||||||||||||||||||||
| 1st quarter 2008 | -0.1 | -3.7 | -0.9 | ||||||||||||||||||||||||||||||||||||||||||||||||||||||||||||||||||||||||||||
| 2nd quarter 2008 | 5.3 | 5.3 | 4.3 | ||||||||||||||||||||||||||||||||||||||||||||||||||||||||||||||||||||||||||||
| 3rd quarter 2008 | 0.3 | 0.3 | 4.2 | ||||||||||||||||||||||||||||||||||||||||||||||||||||||||||||||||||||||||||||
| 4th quarter 2008 | 2.4 | 2.4 | 6.1 | ||||||||||||||||||||||||||||||||||||||||||||||||||||||||||||||||||||||||||||
| 1st quarter 2009 | -0.1 | -2.5 | 5.9 | ||||||||||||||||||||||||||||||||||||||||||||||||||||||||||||||||||||||||||||
| 2nd quarter 2009 | 2.7 | 2.7 | 6.7 | ||||||||||||||||||||||||||||||||||||||||||||||||||||||||||||||||||||||||||||
| 3rd quarter 2009 | 2.1 | 2.1 | 7.3 | ||||||||||||||||||||||||||||||||||||||||||||||||||||||||||||||||||||||||||||
| 4th quarter 2009 | 3.7 | 3.7 | 9.9 | ||||||||||||||||||||||||||||||||||||||||||||||||||||||||||||||||||||||||||||
|
Revisions Quarterly institutional sector accounts are based on preliminary calculations. The uncertainty in the last quarter is the largest. New information is continuously integrated into the figures, which could cause revisions in the previously released data. Quarterly sector accounts are also consolidated against the data from the quarterly national accounts data. When the last quarters of the unadjusted series are updated, seasonally-adjusted series may also be revised backwards. |
Tables
Additional information
Contact
-
Pål Sletten
E-mail: pal.sletten@ssb.no
tel.: (+47) 99 29 06 84
-
Nils Amdal
E-mail: nils.amdal@ssb.no
tel.: (+47) 91 14 91 46


