Content
Published:
This is an archived release.
Growth in mainland Norway
Gross domestic product (GDP) for mainland Norway grew by 2.6 per cent in 2011. The growth in the 4th quarter was 0.6 per cent, of which the main contribution came from the production of service activities.
New table index and tables published 24 February 2012
Table index for the release 16 February was changed as a consequence of the publication of the following tables 24 February 2012:
- 2. Final expenditure and gross domestic product. At constant 2009-prices. NOK million
- 9. Gross domestic product and value added by industry. At constant 2009-prices. NOK million
- 15. Final consumption expenditure. At constant 2009-prices. NOK million
- 19. Final consumption expenditure of households. At constant 2009-prices. NOK million
- 22. Final consumption of households. Seasonally adjusted. At constant 2009-prices. NOK million
- 25. Gross fixed capital formation by type of capital goods and by industry. At constant 2009-prices. NOK million
- 30. Exports of goods and services. At constant 2009-prices. NOK million
- 35. Imports of goods and services. At constant 2009-prices. NOK million
The growth in the 4th quarter came after a growth rate of 0.8 per cent in the 3rd quarter. Both for the 4th quarter and the year as a whole, service producing industries such as technical consultancy, services in information and communication technology and administrative and support services showed strong growth. In the 4th quarter the service producing industries excluding general government contributed to two thirds of the growth in mainland Norway.
Increased activity also in goods producing industries
The activity level in manufacturing began the year with a marked slowdown in the 1st quarter, but growth increased throughout the year and ended with a 1.9 per cent annual growth rate of gross value added. In the 4th quarter, the growth was 1 per cent. The strongest contributions came from the manufacture of machinery and equipment n.e.c., building of oil platforms and modules and repair and installation of machinery and equipment. Export oriented industries such as the manufacture of chemical products, paper and paper products and fish processing experienced a slowdown in the 4th quarter.
In the production of other goods, construction and aquaculture grew strongly, both in the 4th quarter and annually, while the production of electricity and traditional fisheries decreased. In 2011, traditional fisheries were at the same level as in 2010, while aquaculture grew by over 11 per cent. As a whole, production of other goods fell by 1.6 per cent in the 4th quarter and rose by 2.6 per cent from 2010 to 2011.
General government grew by 2.2 per cent in 2011. Local government grew by 2.4 per cent and central government by 1.9 per cent. From the 3rd to the 4th quarter, general government rose by 0.7 per cent.
Total GDP grew by 0.5 per cent in the 4th quarter, slightly less than GDP mainland Norway, which is due to a decrease in gross value added in petroleum activities and ocean transport. In spite of the slowdown in extraction of crude oil and gas, service activities incidental to oil and gas have shown a marked expansion throughout 2011, which is seen in relation to the rise in investments on the continental shelf.
| 2010 | 2011 | 3rd quarter 2010 | 4th quarter 2010 | 1st quarter 2011 | 2nd quarter 2011 | 3rd quarter 2011 | 4th quarter 2011 | ||||||||||||||||||||||||||||||||||||||||||||||||||||||||||||||||||||||||
|---|---|---|---|---|---|---|---|---|---|---|---|---|---|---|---|---|---|---|---|---|---|---|---|---|---|---|---|---|---|---|---|---|---|---|---|---|---|---|---|---|---|---|---|---|---|---|---|---|---|---|---|---|---|---|---|---|---|---|---|---|---|---|---|---|---|---|---|---|---|---|---|---|---|---|---|---|---|---|---|
| Gross domestic product (GDP) | 0.7 | 1.6 | -2.0 | 2.5 | -0.3 | 0.5 | 1.1 | 0.5 | |||||||||||||||||||||||||||||||||||||||||||||||||||||||||||||||||||||||
| GDP Mainland-Norway | 1.9 | 2.6 | 0.7 | 0.4 | 0.4 | 1.3 | 0.8 | 0.6 | |||||||||||||||||||||||||||||||||||||||||||||||||||||||||||||||||||||||
| Petroleum activities and ocean transport | -3.9 | -2.4 | -12.8 | 12.0 | -2.9 | -3.0 | 2.7 | -0.3 | |||||||||||||||||||||||||||||||||||||||||||||||||||||||||||||||||||||||
| Final domestic use of goods and services | 3.1 | 3.1 | -1.4 | 1.7 | 2.7 | -1.3 | -0.8 | 2.2 | |||||||||||||||||||||||||||||||||||||||||||||||||||||||||||||||||||||||
| Final consumption exp. of households | 3.8 | 2.3 | 1.5 | 1.2 | 0.2 | 0.6 | 0.3 | 0.6 | |||||||||||||||||||||||||||||||||||||||||||||||||||||||||||||||||||||||
| Final consumption exp. of general government | 1.7 | 1.5 | -0.2 | 0.4 | -0.3 | 1.6 | 0.7 | 0.5 | |||||||||||||||||||||||||||||||||||||||||||||||||||||||||||||||||||||||
| Gross fixed capital formation | -5.2 | 6.9 | -4.0 | 5.6 | 1.8 | 0.1 | 2.4 | 0.8 | |||||||||||||||||||||||||||||||||||||||||||||||||||||||||||||||||||||||
| Exports | 1.8 | -1.1 | -3.1 | 1.8 | -1.0 | -1.5 | 6.2 | -4.3 | |||||||||||||||||||||||||||||||||||||||||||||||||||||||||||||||||||||||
| Imports | 9.9 | 2.5 | -1.5 | -0.8 | 7.7 | -7.1 | 1.6 | -0.6 | |||||||||||||||||||||||||||||||||||||||||||||||||||||||||||||||||||||||
| Total employed | -0.1 | 1.4 | 0.3 | 0.4 | 0.3 | 0.4 | 0.7 | 0.3 | |||||||||||||||||||||||||||||||||||||||||||||||||||||||||||||||||||||||
| Total man-hours worked | 0.8 | 1.5 | 0.2 | 0.5 | 0.1 | 0.6 | 1.1 | 0.3 | |||||||||||||||||||||||||||||||||||||||||||||||||||||||||||||||||||||||
Slow growth in consumption
Household final consumption expenditure rose by 2.3 per cent in 2011. The growth was due first and foremost to the rise in consumption of services, both for the year where consumption of services grew by 2.6 per cent and in the 4th quarter, which increased by close to 1 per cent.
The consumption of goods on the other hand, grew slowly through 2011. The growth from the 3rd to the 4th quarter was 0.4 per cent. The fall in consumption of electricity served to dampen consumption of goods by 0.2 percentage points in the 4th quarter and 0.6 percentage points for the year in total. The consumption of goods grew by 1.3 per cent in 2011
Direct purchases abroad by resident households increased by 8.2 per cent from 2010 to 2011, with especially strong growth in the first half of 2011.
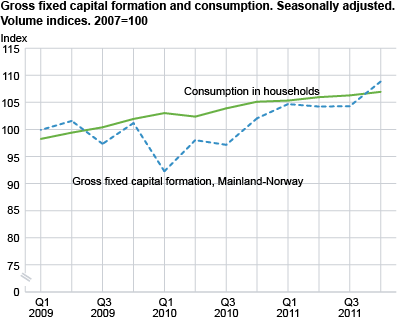

Increased investments
Gross fixed capital formation grew by close to 1 per cent from the 3rd to the 4th quarter. Investments in general government grew strongly in the last two quarters of the year, and ended with a growth rate of 1.3 per cent in 2011. Household investments in dwellings rose markedly again in the 4th quarter, after a weak development in the 3rd quarter. Household investments in dwellings grew by 22 per cent in 2011.
Investments in oil and gas extraction, which make up more than 25 per cent of total investments, fell in the 4th quarter, but were about 11 per cent higher in 2011 than 2010.
Investments in manufacturing industries fell by more than 13 per cent in the 4th quarter. The slowdown was most noticeable in export oriented industries such as in the manufacture of chemical and mineral products. Investments grew by 4.3 per cent in manufacturing from 2010 to 2011.
Fall in exports
The fall in exports of crude oil and natural gas contributed strongly to the fall in total exports of 1.1 per cent from 2010 to 2011. However, exports of traditional goods were also lower in 2011. The second half of the year in particular showed a marked decrease, where exports of traditional goods fell by 1 and 4.9 per cent respectively for the 3rd and 4th quarter. The exports of services grew in the last half of the year, and were up by 3.3 per cent from 2010.
Imports of traditional goods increased by 5.4 per cent in 2011, and 2.1 per cent in the 4th quarter. Total imports were 2.5 per cent higher in 2011 than 2010, but fell by 0.6 per cent in the 4th quarter.
Annual earnings and employment
Employment rose by 0.3 per cent from the 3rd to the 4th quarter. For the year in total, employment was up 1.4 per cent. Higher employment levels were especially evident in construction and local government. Total hours worked grew by 1.5 per cent in 2011, with the strongest growth in the 2nd and 3rd quarter before levelling out in the 4th quarter.
According to preliminary national accounts figures, growth in average annual earnings, all employees, was 4.3 per cent in 2011.
Revisions
For 2011, new information has been incorporated for all quarters. For seasonal and calendar adjusted figures, there are no revisions for GDP mainland Norway, while total GDP has been revised down by 0.3 percentage points in the 3rd quarter and up by 0.2 percentage points in the 1st quarter. For other revisions, please see the table below.
Changes in seasonal adjustment methodThe new method means that seasonally-adjusted figures may be revised back to the base year, while we are using fixed seasonal adjustment factors for older time series. For more on the new method and seasonal adjustment routines please see About seasonal adjustment . The change in method has led us to specially treat GDP in market and basic prices, due to a large discrepancy between the old and the new method. These series have first been adjusted indirectly for the whole period (1978-2011) and afterwards the seasonal factors have been normalised so that both the unadjusted and adjusted series have the same annual level. |
| 1st quarter 2011 | 2nd quarter 2011 | 3rd quarter 2011 | |||||||||||||||||||||||||||||||||||||||||||||||||||||||||||||||||||||||||||||
|---|---|---|---|---|---|---|---|---|---|---|---|---|---|---|---|---|---|---|---|---|---|---|---|---|---|---|---|---|---|---|---|---|---|---|---|---|---|---|---|---|---|---|---|---|---|---|---|---|---|---|---|---|---|---|---|---|---|---|---|---|---|---|---|---|---|---|---|---|---|---|---|---|---|---|---|---|---|---|---|
| Seasonally adjusted figures | Unadjusted figures | Seasonally adjusted figures | Unadjusted figures | Seasonally adjusted figures | Unadjusted figures | ||||||||||||||||||||||||||||||||||||||||||||||||||||||||||||||||||||||||||
| Percentage change in volume from the previous period | Percentage change in volume from the same period in the previous year | Percentage change in volume from the previous period | Percentage change in volume from the same period in the previous year | Percentage change in volume from the previous period | Percentage change in volume from the same period in the previous year | ||||||||||||||||||||||||||||||||||||||||||||||||||||||||||||||||||||||||||
| New result | Former result | New result | Former result | New result | Former result | New result | Former result | New result | Former result | New result | Former result | ||||||||||||||||||||||||||||||||||||||||||||||||||||||||||||||||||||
| Gross domestic product (GDP) | -0.3 | -0.5 | 0.8 | 0.7 | 0.5 | 0.5 | 0.1 | 0.0 | 1.1 | 1.4 | 4.0 | 3.8 | |||||||||||||||||||||||||||||||||||||||||||||||||||||||||||||||||||
| GDP Mainland Norway | 0.4 | 0.4 | 2.1 | 2.0 | 1.3 | 1.3 | 2.5 | 2.3 | 0.8 | 0.8 | 3.0 | 2.9 | |||||||||||||||||||||||||||||||||||||||||||||||||||||||||||||||||||
| Household final consumtion expenditure | 0.2 | 0.3 | 0.9 | 0.8 | 0.6 | 0.8 | 4.4 | 4.3 | 0.3 | 0.2 | 2.7 | 2.5 | |||||||||||||||||||||||||||||||||||||||||||||||||||||||||||||||||||
| Final consumption of general government | -0.3 | -0.3 | 0.4 | 0.1 | 1.6 | -1.1 | 1.2 | 1.3 | 0.7 | 0.2 | 2.4 | 1.8 | |||||||||||||||||||||||||||||||||||||||||||||||||||||||||||||||||||
| Gross fixed capital formation | 1.8 | 0.7 | 9.8 | 9.9 | 0.1 | 0.7 | 3.2 | 5.2 | 2.4 | 1.6 | 10.5 | 11.6 | |||||||||||||||||||||||||||||||||||||||||||||||||||||||||||||||||||
| Exports | -1.0 | -1.5 | -4.2 | -4.4 | -1.5 | -1.4 | -3.7 | -3.5 | 6.2 | 5.8 | 5.0 | 4.4 | |||||||||||||||||||||||||||||||||||||||||||||||||||||||||||||||||||
| Imports | 7.7 | 6.3 | 11.5 | 11.7 | -7.1 | -7.9 | -2.5 | -2.5 | 1.6 | 0.7 | 1.0 | -0.7 | |||||||||||||||||||||||||||||||||||||||||||||||||||||||||||||||||||
| Percentage change in volume from the previous quarter | |||||||||||||||||||||||||||||||||||||||||||||||||||||||||||||||||||||||||||||||
|---|---|---|---|---|---|---|---|---|---|---|---|---|---|---|---|---|---|---|---|---|---|---|---|---|---|---|---|---|---|---|---|---|---|---|---|---|---|---|---|---|---|---|---|---|---|---|---|---|---|---|---|---|---|---|---|---|---|---|---|---|---|---|---|---|---|---|---|---|---|---|---|---|---|---|---|---|---|---|---|
| 2010 | 2011 | ||||||||||||||||||||||||||||||||||||||||||||||||||||||||||||||||||||||||||||||
| 1st quarter | 2nd quarter | 3rd quarter | 4th quarter | 1st quarter | 2nd quarter | 3rd quarter | 4th quarter | ||||||||||||||||||||||||||||||||||||||||||||||||||||||||||||||||||||||||
| Sweden | 1.9 | 2.0 | 1.9 | 1.2 | 0.7 | 1.0 | 1.6 | .. | |||||||||||||||||||||||||||||||||||||||||||||||||||||||||||||||||||||||
| Denmark | 0.0 | 1.5 | 1.1 | -0.5 | 0.0 | 1.0 | -0.5 | .. | |||||||||||||||||||||||||||||||||||||||||||||||||||||||||||||||||||||||
| Finland | 0.7 | 3.0 | 0.1 | 1.5 | 0.2 | 0.1 | 0.9 | .. | |||||||||||||||||||||||||||||||||||||||||||||||||||||||||||||||||||||||
| Germany | 0.5 | 1.9 | 0.8 | 0.5 | 1.3 | 0.3 | 0.5 | .. | |||||||||||||||||||||||||||||||||||||||||||||||||||||||||||||||||||||||
| France | 0.1 | 0.5 | 0.4 | 0.4 | 0.9 | -0.1 | 0.3 | .. | |||||||||||||||||||||||||||||||||||||||||||||||||||||||||||||||||||||||
| UK | 0.4 | 1.1 | 0.7 | -0.5 | 0.4 | 0.0 | 0.6 | -0.2 | |||||||||||||||||||||||||||||||||||||||||||||||||||||||||||||||||||||||
| USA | 1.0 | 0.9 | 0.6 | 0.6 | 0.1 | 0.3 | 0.5 | 0.7 | |||||||||||||||||||||||||||||||||||||||||||||||||||||||||||||||||||||||
| Norway | 0.9 | 0.3 | -2.0 | -2.5 | -0.3 | 0.5 | 1.1 | 0.5 | |||||||||||||||||||||||||||||||||||||||||||||||||||||||||||||||||||||||
Tables
Contact
-
Pål Sletten
E-mail: pal.sletten@ssb.no
tel.: (+47) 99 29 06 84
-
Ingunn Sagelvmo
E-mail: ingunn.sagelvmo@ssb.no
tel.: (+47) 40 90 26 32
-
Pia Tønjum
E-mail: pia.tonjum@ssb.no
tel.: (+47) 48 99 12 07
-
Kristian Gimming
E-mail: kristian.gimming@ssb.no
tel.: (+47) 91 88 39 06