Content
Published:
This is an archived release.
Continued growth in Norwegian economy
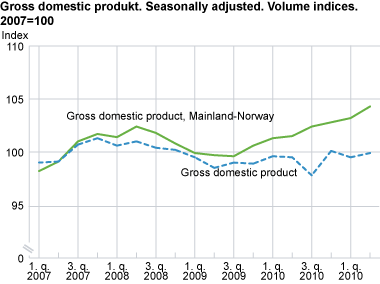
Gross domestic product (GDP) for mainland Norway increased by 1.0 per cent from the 1st to the 2nd quarter, according to preliminary figures from the national accounts. GDP for mainland Norway was 2.4 per cent higher in the first half of 2011 than in the first half of 2010.
Extraction of crude oil and natural gas fell by 3.3 per cent from the 1st to the 2nd quarter and this led to a growth in total GDP of 0.4 per cent. In the first half of 2011, GDP was 0.3 per cent higher than in the same period in 2010.
Marked growth in electricity supply
After a drop in production of electricity from the 4th to the 1st quarter, there was a clear increase in the 2nd quarter. Electricity supply contributed with about a quarter of the total growth in GDP for mainland Norway. The growth in construction was moderate, while manufacturing was reduced by 0.2 per cent.
Increased activity in service producing industries
Production of services grew by 1.9 per cent in the 2nd quarter. Financial intermediation and wholesale and retail trade were the most important contributors. The increase in financial intermediation came after two consecutive quarters with a reduction of gross value added (GVA), and in the 2nd quarter GVA was back to about the same level as three quarters earlier.
| 2010 | 1st quarter 2010 |
2nd quarter 2010 |
3rd quarter 2010 |
4th quarter 2010 |
1st quarter 2011 |
2nd quarter 2011 |
|||||||||||||||||||||||||||||||||||||||||||||||||||||||||||||||||||||||||
|---|---|---|---|---|---|---|---|---|---|---|---|---|---|---|---|---|---|---|---|---|---|---|---|---|---|---|---|---|---|---|---|---|---|---|---|---|---|---|---|---|---|---|---|---|---|---|---|---|---|---|---|---|---|---|---|---|---|---|---|---|---|---|---|---|---|---|---|---|---|---|---|---|---|---|---|---|---|---|---|
| Gross domestic product (GDP) | 0.3 | 0.7 | 0.0 | -1.7 | 2.3 | -0.6 | 0.4 | ||||||||||||||||||||||||||||||||||||||||||||||||||||||||||||||||||||||||
| GDP Mainland-Norway | 2.1 | 0.7 | 0.2 | 0.9 | 0.4 | 0.5 | 1.0 | ||||||||||||||||||||||||||||||||||||||||||||||||||||||||||||||||||||||||
| Petroleum activities and ocean transport | -5.4 | 0.4 | -0.8 | -10.5 | 9.9 | -4.4 | -1.9 | ||||||||||||||||||||||||||||||||||||||||||||||||||||||||||||||||||||||||
| Final domestic use of goods and services | 4.4 | 1.2 | 4.1 | -2.0 | 3.1 | 3.8 | -2.9 | ||||||||||||||||||||||||||||||||||||||||||||||||||||||||||||||||||||||||
| Final consumption exp. of households | 3.7 | 1.1 | -0.3 | 1.1 | 1.2 | 0.3 | 0.8 | ||||||||||||||||||||||||||||||||||||||||||||||||||||||||||||||||||||||||
| Final consumption exp. of general government | 2.2 | 1.2 | 0.7 | 1.2 | -0.6 | 0.1 | 1.0 | ||||||||||||||||||||||||||||||||||||||||||||||||||||||||||||||||||||||||
| Gross fixed capital formation | -7.4 | -14.6 | 9.5 | -4.7 | 6.9 | -1.4 | -0.2 | ||||||||||||||||||||||||||||||||||||||||||||||||||||||||||||||||||||||||
| Exports | -1.7 | 0.3 | -3.7 | -0.9 | -0.4 | -1.6 | 0.4 | ||||||||||||||||||||||||||||||||||||||||||||||||||||||||||||||||||||||||
| Imports | 9.0 | 1.6 | 6.1 | -1.5 | 0.6 | 10.5 | -8.4 | ||||||||||||||||||||||||||||||||||||||||||||||||||||||||||||||||||||||||
| Total employed | -0.2 | -0.3 | 0.2 | 0.2 | 0.2 | 0.3 | 0.3 | ||||||||||||||||||||||||||||||||||||||||||||||||||||||||||||||||||||||||
| Total man-hours worked | 0.5 | -0.3 | 0.3 | 0.7 | 0.0 | 0.1 | 0.4 | ||||||||||||||||||||||||||||||||||||||||||||||||||||||||||||||||||||||||
Increased domestic demand
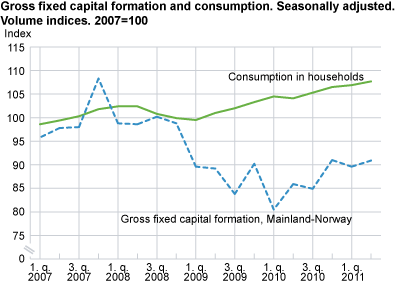
The growth of 0.8 per cent in final consumption expenditure of households was due to increased consumption of both goods and services. Consumption of goods was mainly up because of clothing and footwear and food. Consumption of both electricity and fuel fell in the 2nd quarter and contributed most to dampening the overall growth in household consumption. Purchases of cars were unchanged from the 1st to the 2nd quarter, while consumption of services increased by 0.8 per cent.
Government consumption expenditure increased by 1.0 per cent, while government gross fixed capital formation (GFCF) was markedly reduced after being at a very high level the previous two quarters.
GFCF in mainland Norway excluding general government increased by 5.0 per cent. GFCF in buildings and constructions was at a high level in both the 1st and the 2nd quarter compared to the first half of 2010. The increase was particularly strong in household investments in dwellings where preliminary figures show that the increase in each of the first two quarters of 2011 was more than 8 per cent. Household investments in dwellings have now increased for five consecutive quarters, after having decreased for nearly three years from mid 2007 until the beginning of 2010. There was also a general increase in GFCF in the mainland industries from the 1st to the 2nd quarter of 2011.
Investments in oil and gas-related activities, which amount to approximately 25 per cent of total GFCF, increased by 6.4 per cent in the 2nd quarter.
Increased exports, reduced imports
Exports grew by 0.4 per cent, while imports fell by 8.4 per cent from the 1st to the 2nd quarter. Exports of traditional goods increased by more than 7 per cent in the 2nd quarter, after having dropped for two consecutive quarters. Especially machinery and other equipment and basic metals contributed positively. Reduced exports of crude oil and natural gas dampened the overall growth.
The reduction in imports in the 2nd quarter was largely a result of the extraordinarily high level in the 1st quarter due to the arrival of both a large floating production unit related to oil and gas extraction and a frigate to the coast guard. Without these units, the fall was less than 1 per cent. Imports of traditional goods were reduced by 1.6 per cent, led by a drop in imports of basic metals and electricity.
Still modest growth in employment
The number of employed persons grew by 0.3 per cent in the 2nd quarter, particularly as a result of increased employment in local government, business services and construction. Employment in manufacturing was unchanged since the 1st quarter.
In the first half of 2011 on average approximately 25 000 persons more were employed than in the same period of 2010.
Revisions
Due to the incorporation of new statistics, unadjusted figures for the 1st quarter of 2011 have been revised. Seasonally-adjusted figures for previous quarters may however be revised if the seasonal factors change when new information is introduced in the time series. New figures for service producing industries have led to a downward adjustment of GDP for mainland Norway. The seasonally-adjusted growth in the 1st quarter of 2011 has been revised down by 0.1 percentage points from the previous release. For other revisions, see the table below.
Main revisionThe quarterly national accounts for the 3rd quarter of 2011, which are published at the end of November, will be based on the results of a main revision of the Norwegian national accounts. The industry classification will be revised according to the new Norwegian Standard Industrial Classification (SIC2007). All of the time series of the national accounts will also be revised. |
| 1st quarter 2010 | 2nd quarter 2010 | 3rd quarter 2010 | 4th quarter 2010 | 1st quarter 2010 | |||||||||||||||||||||||||||||||||||||||||||||||||||||||||||||||||||||||||||
|---|---|---|---|---|---|---|---|---|---|---|---|---|---|---|---|---|---|---|---|---|---|---|---|---|---|---|---|---|---|---|---|---|---|---|---|---|---|---|---|---|---|---|---|---|---|---|---|---|---|---|---|---|---|---|---|---|---|---|---|---|---|---|---|---|---|---|---|---|---|---|---|---|---|---|---|---|---|---|---|
| Seasonally adjusted figures | Seasonally adjusted figures | Seasonally adjusted figures | Seasonally adjusted figures | Seasonally adjusted figures | Unadjusted figures | ||||||||||||||||||||||||||||||||||||||||||||||||||||||||||||||||||||||||||
| Percentage change in volume from the previous period | Percentage change in volume from the previous period | Percentage change in volume from the previous period | Percentage change in volume from the previous period | Percentage change in volume from the previous period | Percentage change in volume from the same period in the previous year | ||||||||||||||||||||||||||||||||||||||||||||||||||||||||||||||||||||||||||
| New result | Former result | New result | Former result | New result | Former result | New result | Former result | New result | Former result | New result | Former result | ||||||||||||||||||||||||||||||||||||||||||||||||||||||||||||||||||||
| Gross domestic product (GDP) | 0.7 | 0.7 | 0.0 | -0.1 | -1.7 | -1.6 | 2.3 | 2.3 | -0.6 | -0.4 | 0.9 | 1.0 | |||||||||||||||||||||||||||||||||||||||||||||||||||||||||||||||||||
| GDP Mainland Norway | 0.7 | 0.7 | 0.2 | 0.3 | 0.9 | 0.8 | 0.4 | 0.3 | 0.5 | 0.6 | 2.5 | 2.7 | |||||||||||||||||||||||||||||||||||||||||||||||||||||||||||||||||||
| Household final consumtion expenditure | 1.1 | 1.0 | -0.3 | -0.2 | 1.1 | 1.2 | 1.2 | 1.2 | 0.3 | 0.0 | 1.0 | 0.8 | |||||||||||||||||||||||||||||||||||||||||||||||||||||||||||||||||||
| Final consumption of general government | 1.2 | 1.3 | 0.7 | 0.7 | 1.2 | 1.0 | -0.6 | -0.6 | 0.1 | -0.2 | 2.6 | 2.2 | |||||||||||||||||||||||||||||||||||||||||||||||||||||||||||||||||||
| Gross fixed capital formation | -14.6 | -14.3 | 9.5 | 10.3 | -4.7 | -5.4 | 6.9 | 6.4 | -1.4 | 2.3 | 10.7 | 14.3 | |||||||||||||||||||||||||||||||||||||||||||||||||||||||||||||||||||
| Exports | 0.3 | 1.2 | -3.7 | -5.5 | -0.9 | 0.3 | -0.4 | -0.4 | -1.6 | -0.5 | -5.9 | -5.9 | |||||||||||||||||||||||||||||||||||||||||||||||||||||||||||||||||||
| Imports | 1.6 | 1.1 | 6.1 | 6.7 | -1.5 | -1.5 | 0.6 | 0.5 | 10.5 | 10.7 | 17.0 | 17.9 | |||||||||||||||||||||||||||||||||||||||||||||||||||||||||||||||||||
Tables
Contact
-
Pål Sletten
E-mail: pal.sletten@ssb.no
tel.: (+47) 99 29 06 84
-
Ingunn Sagelvmo
E-mail: ingunn.sagelvmo@ssb.no
tel.: (+47) 40 90 26 32
-
Pia Tønjum
E-mail: pia.tonjum@ssb.no
tel.: (+47) 48 99 12 07
-
Kristian Gimming
E-mail: kristian.gimming@ssb.no
tel.: (+47) 91 88 39 06


