Content
Published:
This is an archived release.
Moderate growth in mainland Norway
Gross domestic product (GDP) for mainland Norway grew by 2.2 per cent in 2010 after having dropped by 1.3 per cent in 2009. The growth in the 4th quarter was 0.3 per cent and mainly came as a result of an increase in both final consumption expenditure of households and gross fixed capital formation.
Seasonally-adjusted constant price figures show that the growth in GDP for mainland Norway in the 4th quarter was 0.3 per cent after being up by 1.1 per cent in the previous quarter. The growth was relatively high in most of the industries, but with two important exceptions: financial intermediation and traditional fisheries, which together had a negative growth impact of 0.5 percentage points. The slowdown in the traditional fisheries at the end of the year must however be seen in relation to the high catch yield in the first three quarters. The primary industries in total grew by approximately 10 per cent from 2009 to 2010, and alone contributed 0.2 percentage points of the annual GDP growth for mainland Norway.
The service producing industries, led by wholesale and retail trade, contributed most to the growth in the 4th quarter. Gross value added (GVA) in financial intermediation grew in the first half of 2010, but has since fallen for two consecutive quarters. The downturn in the 4th quarter was related to an increase in costs.
GVA in manufacturing increased in the last three quarters of 2010 after being down in the beginning of the year. The growth in the 4th quarter was 0.8 per cent, while the annual growth was 1.9 per cent. Production of chemical products contributed strongly to the growth.
After having dropped slightly in the first quarter, construction has now grown for three consecutive quarters. The growth from the 3rd to the 4th quarter was 1.4 per cent, while the annual growth was 0.4 per cent. Production of electricity and gas supply fell in the first half but then grew increasingly in the last half of 2010. The growth in the 4th quarter was 8.8 per cent, and in isolation this made a positive contribution of 0.1 percentage points to GDP mainland Norway. The annual figure however shows a drop in value added of 3.3 per cent.
General government activity increased by 2.2 per cent in 2010 and with that contributed 0.4 percentage points to the overall growth of GDP mainland Norway. The growth in the 4th quarter was 0.2 per cent.
The constant price growth for total GDP was 0.4 per cent in 2010 due to a slowdown in oil and gas extraction. The GDP growth in the 4th quarter was 2.4 per cent, however this must be seen in relation to the strong growth in extraction of oil and gas in the 4th quarter that followed a marked drop in the 3rd quarter due to planned maintenance of oil fields on the continental shelf.
| 2009 | 2010 | 1st quarter 2009 | 2nd quarter 2009 | 3rd quarter 2009 | 4th quarter 2009 | 1st quarter 2010 | 2nd quarter 2010 | 3rd quarter 2010 | 4th quarter 2010 | ||||||||||||||||||||||||||||||||||||||||||||||||||||||||||||||||||||||
|---|---|---|---|---|---|---|---|---|---|---|---|---|---|---|---|---|---|---|---|---|---|---|---|---|---|---|---|---|---|---|---|---|---|---|---|---|---|---|---|---|---|---|---|---|---|---|---|---|---|---|---|---|---|---|---|---|---|---|---|---|---|---|---|---|---|---|---|---|---|---|---|---|---|---|---|---|---|---|---|
| Gross domestic product (GDP) | -1.4 | 0.4 | -0.4 | -1.0 | 0.6 | -0.2 | 0.6 | 0.0 | -1.5 | 2.4 | |||||||||||||||||||||||||||||||||||||||||||||||||||||||||||||||||||||
| GDP Mainland-Norway | -1.3 | 2.2 | -0.4 | 0.1 | -0.1 | 0.8 | 0.6 | 0.4 | 1.1 | 0.3 | |||||||||||||||||||||||||||||||||||||||||||||||||||||||||||||||||||||
| Petroleum activities and ocean transport | -1.7 | -5.4 | -0.3 | -4.3 | 3.2 | -3.4 | 0.5 | -1.6 | -10.3 | 10.7 | |||||||||||||||||||||||||||||||||||||||||||||||||||||||||||||||||||||
| Final domestic use of goods and services | -3.7 | 4.2 | -4.0 | 0.9 | -0.2 | 0.1 | 0.7 | 5.0 | -3.1 | 3.5 | |||||||||||||||||||||||||||||||||||||||||||||||||||||||||||||||||||||
| Final consumption exp. of households | 0.0 | 3.7 | -0.6 | 1.7 | 1.1 | 1.2 | 0.9 | -0.2 | 1.2 | 1.1 | |||||||||||||||||||||||||||||||||||||||||||||||||||||||||||||||||||||
| Final consumption exp. of general government | 4.7 | 2.2 | 2.3 | 1.0 | 1.3 | -0.4 | -0.2 | 1.2 | 1.7 | 0.4 | |||||||||||||||||||||||||||||||||||||||||||||||||||||||||||||||||||||
| Gross fixed capital formation | -7.4 | -8.9 | -5.4 | -5.2 | -5.2 | 8.0 | -14.4 | 8.1 | -6.6 | 8.1 | |||||||||||||||||||||||||||||||||||||||||||||||||||||||||||||||||||||
| Exports | -4.0 | -1.3 | -2.9 | -2.9 | 3.5 | 0.6 | 0.1 | -4.5 | 1.5 | -0.7 | |||||||||||||||||||||||||||||||||||||||||||||||||||||||||||||||||||||
| Imports | -11.4 | 8.7 | -13.9 | 1.5 | 2.7 | 1.9 | 0.2 | 7.7 | -1.9 | 1.1 | |||||||||||||||||||||||||||||||||||||||||||||||||||||||||||||||||||||
| Total employed | -0.4 | -0.2 | -0.4 | -0.4 | -0.2 | 0.0 | -0.2 | 0.2 | 0.2 | 0.2 | |||||||||||||||||||||||||||||||||||||||||||||||||||||||||||||||||||||
| Total man-hours worked | -1.8 | 0.6 | -0.6 | -0.3 | -0.4 | -0.2 | -0.3 | 0.4 | 0.6 | 0.1 | |||||||||||||||||||||||||||||||||||||||||||||||||||||||||||||||||||||

Marked growth in consumption of goods
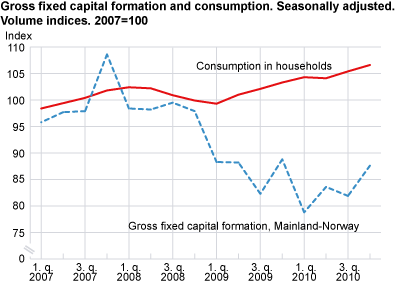
Household final consumption expenditure increased by 3.7 per cent in 2010. The growth in consumption of goods was slow in the first half, but then gained momentum in the second half and led to an annual growth of 4.0 per cent. About half of this is due to an increase in buying of motor vehicles. The marked growth of household consumption of services in the beginning of the year slowed down in the second half of 2010. In spite of the problems related to the ash cloud following the volcanic eruption in Iceland in the second quarter, tourism both to and from Norway increased in 2010. The growth in household consumption abroad was particularly strong and alone pulled up the total final consumption expenditure by 0.7 percentage points.
In the 4th quarter, consumption of goods grew by 1.6 per cent, while consumption of services was up by 0.5 per cent. Consumption of electricity made a contribution of 0.3 percentage points to the total consumption expenditure of households in the 4th quarter. This must however be seen in relation to the unusually low temperatures towards the end of 2010.
Reduced investments
Gross fixed capital formation was down by 8.9 per cent in 2010, primarily because of reduced investments in oil and gas-related activities. Gross fixed capital formation in manufacturing was also down in 2010. The largest contribution to the drop was from basic chemicals after a few consecutive years of high investment levels in order to increase the production capacity.
Gross fixed capital formation grew by 8.1 per cent in the 4th quarter after having dropped by 6.6 per cent in the previous quarter. Both gross fixed capital in manufacturing and oil and gas-related activities contributed positively.
Household investments in dwellings increased through all four quarters of 2010. The growth in the 4th quarter was 1.0 per cent. The annual figure, however, fell by 3.5 per cent as a result of the steep drop in investments through 2009.
Reduced exports, increased imports
Exports decreased by 1.3 per cent in 2010 as a result of a drop in exports of crude oil. Exports of traditional goods were however up by 5.0 per cent. In the 4th quarter, exports of traditional goods fell by 3.8 per cent because of inter alia less exports of fish and fish products and refined petroleum products.
Total imports increased by 8.7 per cent in 2010, while imports of traditional goods were up by 8.4 per cent. The strong growth in imports of motor vehicles must be seen in relation to the increased demand from households. Imports of traditional goods were up by 2.3 per cent after having dropped the previous quarter.
Slow employment growth in the 4th quarter
Employment grew for the third consecutive quarter. The growth was 0.2 per cent as in the two previous quarters.
On average, 0.2 per cent fewer people were employed in 2010 compared to 2009. Since 2008, employment in general government has increased by nearly 40 000 persons, while employment outside general government is reduced by 56 000 persons in the same period.
Capital transfer from central to local governmentFrom 1 January 2010, responsibility for parts of the main road network was transferred from central to local government. This transfer of capital within the public sector affects both value added and consumption, which has been revised down in central government and up by the same amount in local government. General government overall is unaffected by the capital transfer. |
Revisions
New information about the first three quarters of 2010 is incorporated in the figures. This has led to an upwards revision of the unadjusted figures for GDP mainland Norway by 0.4 percentage points in the 1st quarter, 0.1 percentage points in the 2nd quarter and 0.6 percentage points in the 3rd quarter, mainly due to new information concerning taxes and subsidies on products.
The seasonally-adjusted figures for GDP mainland Norway are revised up by 0.1 percentage points in the 1st quarter, down by 0.1 percentage points in the 2nd quarter and up by 0.2 percentage points in the third quarter.
Although no new information about 2009 has been incorporated, the seasonally-adjusted figures have changed from the previous release as a result of a recalculation of the seasonal factors based on the changes in 2010. GDP mainland Norway is revised up by 0.1 percentage points in the 1st and the 2nd quarter and by 0.2 percentage points in the 4th quarter.
| 1st quarter 2010 | 2nd quarter 2010 | 3rd quarter 2010 | |||||||||||||||||||||||||||||||||||||||||||||||||||||||||||||||||||||||||||||
|---|---|---|---|---|---|---|---|---|---|---|---|---|---|---|---|---|---|---|---|---|---|---|---|---|---|---|---|---|---|---|---|---|---|---|---|---|---|---|---|---|---|---|---|---|---|---|---|---|---|---|---|---|---|---|---|---|---|---|---|---|---|---|---|---|---|---|---|---|---|---|---|---|---|---|---|---|---|---|---|
| Seasonally adjusted figures | Unadjusted figures | Seasonally adjusted figures | Unadjusted figures | Seasonally adjusted figures | Unadjusted figures | ||||||||||||||||||||||||||||||||||||||||||||||||||||||||||||||||||||||||||
| Percentage change in volume from the previous period | Percentage change in volume from the same period in the previous year | Percentage change in volume from the previous period | Percentage change in volume from the same period in the previous year | Percentage change in volume from the previous period | Percentage change in volume from the same period in the previous year | ||||||||||||||||||||||||||||||||||||||||||||||||||||||||||||||||||||||||||
| New result | Former result | New result | Former result | New result | Former result | New result | Former result | New result | Former result | New result | Former result | ||||||||||||||||||||||||||||||||||||||||||||||||||||||||||||||||||||
| Gross domestic product (GDP) | 0.6 | 0.5 | -0.6 | -0.8 | 0.0 | -0.2 | 1.7 | 1.6 | -1.5 | -1.6 | -1.0 | -1.4 | |||||||||||||||||||||||||||||||||||||||||||||||||||||||||||||||||||
| GDP Mainland Norway | 0.6 | 0.5 | 0.8 | 0.4 | 0.4 | 0.5 | 2.2 | 2.1 | 1.1 | 0.9 | 3.0 | 2.4 | |||||||||||||||||||||||||||||||||||||||||||||||||||||||||||||||||||
| Household final consumtion expenditure | 0.9 | 0.7 | 6.1 | 6.0 | -0.2 | -0.2 | 2.2 | 2.0 | 1.2 | 1.3 | 3.3 | 3.3 | |||||||||||||||||||||||||||||||||||||||||||||||||||||||||||||||||||
| Final consumption of general government | -0.2 | 1.3 | 1.1 | 1.9 | 1.2 | 1.3 | 1.8 | 3.3 | 1.7 | 0.7 | 2.3 | 2.7 | |||||||||||||||||||||||||||||||||||||||||||||||||||||||||||||||||||
| Gross fixed capital formation | -14.4 | -14.0 | -18.0 | -17.8 | 8.1 | 7.9 | -5.1 | -4.3 | -6.6 | -7.0 | -6.5 | -7.8 | |||||||||||||||||||||||||||||||||||||||||||||||||||||||||||||||||||
| Exports | 0.1 | 0.1 | 0.9 | 1.5 | -4.5 | -4.3 | -0.5 | 0.0 | 1.5 | -1.3 | -2.3 | -4.3 | |||||||||||||||||||||||||||||||||||||||||||||||||||||||||||||||||||
| Imports | 0.2 | 0.9 | 6.3 | 7.0 | 7.7 | 6.5 | 13.4 | 12.9 | -1.9 | 0.0 | 7.7 | 10.1 | |||||||||||||||||||||||||||||||||||||||||||||||||||||||||||||||||||
| Percentage change in volume from the previous quarter | |||||||||||||||||||||||||||||||||||||||||||||||||||||||||||||||||||||||||||||||
|---|---|---|---|---|---|---|---|---|---|---|---|---|---|---|---|---|---|---|---|---|---|---|---|---|---|---|---|---|---|---|---|---|---|---|---|---|---|---|---|---|---|---|---|---|---|---|---|---|---|---|---|---|---|---|---|---|---|---|---|---|---|---|---|---|---|---|---|---|---|---|---|---|---|---|---|---|---|---|---|
| 2008 | 2009 | 2010 | |||||||||||||||||||||||||||||||||||||||||||||||||||||||||||||||||||||||||||||
| 4th quarter | 1st quarter | 2nd quarter | 3rd quarter | 4th quarter | 1st quarter | 2nd quarter | 3rd quarter | 4th quarter | |||||||||||||||||||||||||||||||||||||||||||||||||||||||||||||||||||||||
| Sweden | -4.1 | -2.6 | 0.3 | -0.1 | 0.9 | 1.7 | 2.0 | 2.1 | .. | ||||||||||||||||||||||||||||||||||||||||||||||||||||||||||||||||||||||
| Denmark | -2.6 | -1.6 | -2.4 | 0.4 | 0.5 | 0.7 | 1.3 | 1.0 | .. | ||||||||||||||||||||||||||||||||||||||||||||||||||||||||||||||||||||||
| Finland | -3.1 | -5.6 | -1.1 | 1.3 | 0.3 | 0.1 | 2.6 | 0.5 | .. | ||||||||||||||||||||||||||||||||||||||||||||||||||||||||||||||||||||||
| Germany | -2.2 | -3.4 | 0.5 | 0.7 | 0.3 | 0.6 | 2.3 | 0.7 | .. | ||||||||||||||||||||||||||||||||||||||||||||||||||||||||||||||||||||||
| France | -1.5 | -1.5 | 0.2 | 0.2 | 0.6 | 0.2 | 0.6 | 0.3 | .. | ||||||||||||||||||||||||||||||||||||||||||||||||||||||||||||||||||||||
| UK | -2.1 | -2.2 | -0.8 | -0.3 | 0.5 | 0.3 | 1.1 | 0.7 | -0.5 | ||||||||||||||||||||||||||||||||||||||||||||||||||||||||||||||||||||||
| USA | -1.7 | -1.2 | -0.2 | 0.4 | 1.2 | 0.9 | 0.4 | 0.6 | 0.8 | ||||||||||||||||||||||||||||||||||||||||||||||||||||||||||||||||||||||
| Norway | -0.3 | -0.4 | -1.0 | 0.6 | -0.2 | 0.6 | 0.0 | -1.5 | 2.4 | ||||||||||||||||||||||||||||||||||||||||||||||||||||||||||||||||||||||
Tables
Contact
-
Pål Sletten
E-mail: pal.sletten@ssb.no
tel.: (+47) 99 29 06 84
-
Ingunn Sagelvmo
E-mail: ingunn.sagelvmo@ssb.no
tel.: (+47) 40 90 26 32
-
Pia Tønjum
E-mail: pia.tonjum@ssb.no
tel.: (+47) 48 99 12 07
-
Kristian Gimming
E-mail: kristian.gimming@ssb.no
tel.: (+47) 91 88 39 06