Content
Published:
This is an archived release.
Increased activity in the mainland economy
Preliminary figures from the quarterly national accounts show that the gross domestic product (GDP) for Mainland Norway rose by 0.5 per cent in the 3 r d quarter due to inter alia increased production in manufacturing and construction.
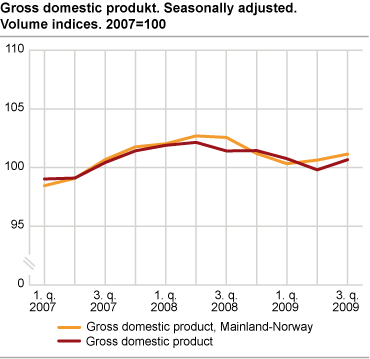
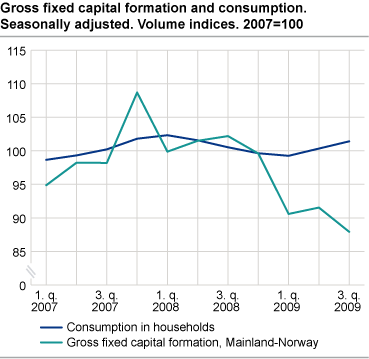
Both household and government final consumption expenditure increased, while gross fixed capital formation in the mainland economy declined. Exports also rose and contributed to the activity growth.
Production in manufacturing advanced in the 3 r d quarter and contributed positively to the growth in GDP for Mainland Norway. Increased activity in production of food products and production of basic metals contributed most to the overall growth of 1.8 per cent in manufacturing and mining.
Gross value added in construction rose by 1.8 per cent. Fishing and fish farming also contributed positively to the increase in the mainland economy, while a reduction in business services dampened the growth. Production of electricity increased from the 2 n d to the 3 r d quarter and had a positive impact of 0.1 percentage points to the growth in GDP for Mainland Norway. Approximately one third of the growth in GDP for Mainland Norway comes from increased activity in general government.
Total GDP increased by 0.9 per cent, mainly as a result of increased activity in oil and gas extraction in the 3 r d quarter.
The new figures from the quarterly national accounts show that the activity level in Mainland Norway in the first three quarters of 2009 was 1.9 per cent lower than the same period of 2008.
| 2007 | 2008 | 2nd quarter 2008 | 3rd quarter 2008 | 4th quarter 2008 | 1st quarter 2009 | 2nd quarter 2009 | 3rd quarter 2009 | ||||||||||||||||||||||||||||||||
|---|---|---|---|---|---|---|---|---|---|---|---|---|---|---|---|---|---|---|---|---|---|---|---|---|---|---|---|---|---|---|---|---|---|---|---|---|---|---|---|
| Gross domestic product (GDP) | 2.7 | 1.8 | 0.2 | -0.7 | 0.0 | -0.7 | -0.9 | 0.9 | |||||||||||||||||||||||||||||||
| GDP Mainland-Norway | 5.6 | 2.2 | 0.7 | -0.1 | -1.3 | -0.9 | 0.3 | 0.5 | |||||||||||||||||||||||||||||||
| Petroleum activities and ocean transport | -5.0 | 0.6 | -1.1 | -2.6 | 4.5 | -0.1 | -4.8 | 2.0 | |||||||||||||||||||||||||||||||
| Final domestic use of goods and services | 5.0 | 2.5 | -1.0 | 1.8 | -3.2 | -1.0 | 0.9 | -1.5 | |||||||||||||||||||||||||||||||
| Final consumption exp. of households | 5.6 | 1.2 | -0.7 | -1.0 | -0.9 | -0.4 | 1.1 | 1.1 | |||||||||||||||||||||||||||||||
| Final consumption exp. of general government | 3.0 | 4.1 | 0.9 | 1.0 | 0.8 | 2.3 | 1.8 | 1.2 | |||||||||||||||||||||||||||||||
| Gross fixed capital formation | 12.5 | 1.4 | 0.7 | 1.1 | -1.1 | -5.0 | -0.5 | -4.8 | |||||||||||||||||||||||||||||||
| Exports | 2.3 | 0.9 | 1.5 | -4.5 | 2.3 | -4.6 | -2.9 | 4.6 | |||||||||||||||||||||||||||||||
| Imports | 8.6 | 2.2 | -1.2 | 0.6 | -5.8 | -7.8 | 1.5 | -0.8 | |||||||||||||||||||||||||||||||
| Total employed | 4.1 | 3.1 | 0.7 | 1.0 | -0.2 | -0.4 | -0.4 | -0.4 | |||||||||||||||||||||||||||||||
| Total man-hours worked | 4.4 | 3.4 | 0.4 | 0.9 | -0.6 | -0.7 | -0.2 | -0.5 | |||||||||||||||||||||||||||||||
Increase in household final consumption expenditure
After having declined from the 2 n d quarter of 2008 until the 1 s t quarter of 2009, household final consumption expenditure has grown in the two previous quarters. There was an increase in the consumption of both goods and services. Consumption of goods was up by 1.9 per cent and consumption of cars accounted for approximately half of this growth. Household final consumption of services grew more moderately by 0.4 per cent. Direct purchases abroad by resident households were down for the sixth quarter in a row.
Increased consumption of healthcare services both in central and local government contributed most to the growth of 1.2 per cent in final consumption expenditure in general government.
Reduction in gross fixed capital formation in Mainland Norway
Gross fixed capital formation in manufacturing receded in the 3 r d quarter. Household investments in dwellings continued to fall, while an increase in gross fixed capital formation by general government dampened the overall reduction.
0.4 per cent drop in employment
The number of employed persons fell by 0.4 per cent from the 2 n d to the 3 r d quarter. A reduction in wholesale and retail trade, business services and manufacturing contributed most to the drop, while increased employment in both central and local government dampened the overall reduction. The number of employed persons was about 40 000 lower in the 3 r d quarter of 2009 compared to the same quarter of 2008.
Increased exports of traditional goods
Both imports and exports of traditional goods increased in the 3 r d quarter. Exports of traditional goods grew by 6.6 per cent, while imports of traditional goods rose by 1.2 per cent.
Revisions of 2009Due to the incorporation of new statistics there have been some revisions for 2007, 2008 and 2009 since the last release of the quarterly national accounts. The constant price figures are measured in 2007 prices as opposed to 2006 prices in the previous release. Seasonally adjusted GDP for Mainland Norway is revised up by 0.4 percentage points in the 1 s t quarter, while the growth rate in the 2 n d quarter is unchanged.
For 2007 and 2008, the revisions are explained here. |
| 2008 | 4th quarter 2008 | 1st quarter 2009 | 2nd quarter 2009 | ||||||||||||||||||||||||||||||||||||
|---|---|---|---|---|---|---|---|---|---|---|---|---|---|---|---|---|---|---|---|---|---|---|---|---|---|---|---|---|---|---|---|---|---|---|---|---|---|---|---|
| New result | Former result | Seasonally adjusted figures | Unadjusted figures | Seasonally adjusted figures | Unadjusted figures | Seasonally adjusted figures | Unadjusted figures | ||||||||||||||||||||||||||||||||
| Percentage change in volume from the previous period | Percentage change in volume from the same period in the previous year | Percentage change in volume from the previous period | Percentage change in volume from the same period in the previous year | Percentage change in volume from the previous period | Percentage change in volume from the same period in the previous year | ||||||||||||||||||||||||||||||||||
| New result | Former result | New result | Former result | New result | Former result | New result | Former result | New result | Former result | New result | Former result | ||||||||||||||||||||||||||||
| Gross domestic product (GDP) | 1.8 | 2.1 | 0.0 | 0.4 | 0.2 | 0.7 | -0.7 | -0.8 | 1.2 | 1.1 | -0.9 | -1.3 | -5.0 | -4.8 | |||||||||||||||||||||||||
| GDP Mainland Norway | 2.2 | 2.6 | -1.3 | -1.0 | -0.4 | 0.3 | -0.9 | -1.3 | 0.8 | 0.8 | 0.3 | 0.3 | -5.2 | -5.0 | |||||||||||||||||||||||||
| Household final consumtion expenditure | 1.2 | 1.3 | -0.9 | -0.8 | -1.7 | -1.5 | -0.4 | -0.5 | -2.6 | -2.2 | 1.1 | 0.6 | -2.1 | -2.4 | |||||||||||||||||||||||||
| Final consumption of general government | 4.1 | 3.8 | 0.8 | 1.4 | 3.3 | 3.9 | 2.3 | 1.4 | 7.9 | 7.5 | 1.8 | 2.0 | 1.5 | 1.4 | |||||||||||||||||||||||||
| Gross fixed capital formation | 1.4 | 3.9 | -1.1 | 0.2 | -4.6 | -0.9 | -5.0 | -5.0 | -4.4 | -3.2 | -0.5 | 0.1 | -6.0 | -4.0 | |||||||||||||||||||||||||
| Exports | 0.9 | 1.4 | 2.3 | 2.4 | -0.4 | 0.7 | -4.6 | -5.6 | -4.4 | -4.8 | -2.9 | -2.9 | -10.7 | -10.0 | |||||||||||||||||||||||||
| Imports | 2.2 | 4.4 | -5.8 | -4.3 | -6.8 | -3.6 | -7.8 | -10.3 | -11.9 | -12.8 | 1.5 | 2.2 | -13.7 | -14.3 | |||||||||||||||||||||||||
| Percentage change in volume from the previous quarter | |||||||||||||||||||||||||||||||||||||||
|---|---|---|---|---|---|---|---|---|---|---|---|---|---|---|---|---|---|---|---|---|---|---|---|---|---|---|---|---|---|---|---|---|---|---|---|---|---|---|---|
| 2008 | 2009 | ||||||||||||||||||||||||||||||||||||||
| 1st quarter | 2nd quarter | 3rd quarter | 4th quarter | 1st quarter | 2nd quarter | 3rd quarter | |||||||||||||||||||||||||||||||||
| Sweden | 0.5 | -0.2 | -0.5 | -4.9 | -0.9 | 0.2 | .. | ||||||||||||||||||||||||||||||||
| Denmark | -1.3 | 1.0 | -1.4 | -2.0 | -1.3 | -2.6 | .. | ||||||||||||||||||||||||||||||||
| Finland | 0.7 | 0.0 | -1.1 | -2.5 | -3.0 | -2.6 | .. | ||||||||||||||||||||||||||||||||
| Germany | 1.6 | -0.6 | -0.3 | -2.4 | -3.5 | 0.4 | 0.7 | ||||||||||||||||||||||||||||||||
| France | 0.5 | -0.4 | -0.2 | -1.5 | -1.4 | 0.3 | 0.3 | ||||||||||||||||||||||||||||||||
| UK | 0.6 | -0.1 | -0.7 | -1.8 | -2.5 | -0.6 | -0.4 | ||||||||||||||||||||||||||||||||
| USA | -0.2 | 0.4 | -0.7 | -1.4 | -1.6 | -0.2 | 0.9 | ||||||||||||||||||||||||||||||||
| Norway | 0.5 | 0.2 | -0.7 | 0.0 | -0.7 | -0.9 | 0.9 | ||||||||||||||||||||||||||||||||
Tables
Contact
-
Pål Sletten
E-mail: pal.sletten@ssb.no
tel.: (+47) 99 29 06 84
-
Ingunn Sagelvmo
E-mail: ingunn.sagelvmo@ssb.no
tel.: (+47) 40 90 26 32
-
Pia Tønjum
E-mail: pia.tonjum@ssb.no
tel.: (+47) 48 99 12 07
-
Kristian Gimming
E-mail: kristian.gimming@ssb.no
tel.: (+47) 91 88 39 06