Content
Published:
This is an archived release.
Growth in the Norwegian economy continues
The Norwegian economy has continued its strong growth since the second quarter of 2003. According to the seasonally adjusted national accounts figures, growth also continued during the third quarter of 2006. As before, the growth is mainly driven by the high activity in the private service industries.
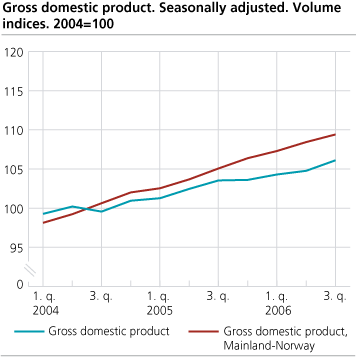
Compared with the previous quarter, GDP for mainland Norway rose by 0.9 per cent in the third quarter this year. The growth can primarily be explained by the increased activity in the business services, wholesale and retail trade as well as financial intermediary services. GDP for mainland Norway rose by 4.6 per cent during the first three quarters of this year compared with the same period last year.
| Gross domestic product 3. quarter 2005 to 3. quarter 2006. Percentage change in volume from the previous period (seasonally adjusted) |
| 2004 | 2005 | 3. quarter 2005 | 4. quarter 2005 | 1. quarter 2006 | 2. quarter 2006 | 3. quarter 2006 | |||||||||||||||||||||||||||||||||
|---|---|---|---|---|---|---|---|---|---|---|---|---|---|---|---|---|---|---|---|---|---|---|---|---|---|---|---|---|---|---|---|---|---|---|---|---|---|---|---|
| Gross domestic product (GDP) | 3.9 | 2.4 | 1.1 | 0.1 | 0.7 | 0.5 | 1.3 | ||||||||||||||||||||||||||||||||
| Mainland-Norway | 4.4 | 4.1 | 1.3 | 1.2 | 0.9 | 1.1 | 0.9 | ||||||||||||||||||||||||||||||||
| Petroleum activities and ocean transport | 1.7 | -3.6 | 0.0 | -4.3 | -0.1 | -2.0 | 2.9 | ||||||||||||||||||||||||||||||||
| Final domestic use of goods and services | 6.7 | 5.3 | 2.4 | 1.3 | 0.7 | 1.4 | 1.7 | ||||||||||||||||||||||||||||||||
| Final consumption exp. of households | 5.5 | 3.1 | 0.4 | -0.5 | 1.9 | 1.5 | 0.7 | ||||||||||||||||||||||||||||||||
| Final consumption exp. of general government | 1.5 | 1.8 | -0.3 | 0.3 | 0.7 | 0.2 | -0.1 | ||||||||||||||||||||||||||||||||
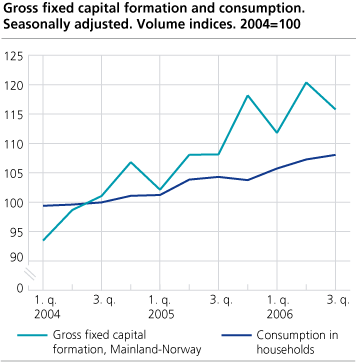
| Gross fixed capital formation | 10.2 | 11.2 | 0.4 | 12.6 | -7.4 | 6.2 | 0.1 | ||||||||||||||||||||||||||||||||
| Exports | 1.1 | 0.6 | -0.6 | -0.2 | -0.5 | 0.9 | -0.5 | ||||||||||||||||||||||||||||||||
| Imports | 8.8 | 8.6 | 2.7 | 3.2 | -0.7 | 3.8 | 0.4 | ||||||||||||||||||||||||||||||||
| Total employed | 0.5 | 1.0 | 0.4 | 0.4 | 1.1 | 0.9 | 0.7 | ||||||||||||||||||||||||||||||||
| Total man-hours worked | 1.8 | 1.2 | 0.2 | 0.3 | 0.8 | 0.7 | 0.7 | ||||||||||||||||||||||||||||||||
Manufacturing has been on an upward trend since the third quarter of 2003, and increased by 0.5 per cent in the third quarter this year. Increased activity in the manufacturing of machinery and other equipment, chemical and mineral products and building of oil platforms were the main reasons of this expansion.
After a downward turn in the second quarter, oil and gas extraction industry showed a strong growth in the third quarter. This resulted in the GDP rise of 1.3 per cent from the second to the third quarter.
Employment growth continues
The strong growth in employment continued in the third quarter. Most of this can be explained by the increased employment in the public health and social sector. There was a high demand for manpower in the construction sector, business services and in some of the manufacturing industries as well. In the third quarter of 2006, 74 000 more persons were employed in comparison to the same quarter last year.
Increased demand in commodities
Household final consumption grew by 0.7 per cent in the third quarter. Consumption of the commodities increased by 1.2 per cent and this is the main factor that triggered the rise in total household consumption. The main reason was spending on clothing and footwear, cars and food. Expenditure on the services was almost unchanged compared to the previous quarter.
Compared with the same period last year, government consumption expenditure for the first three quarters showed about 1.6 percent increase. This can mainly be attributed to the growth in public services of health and social care as well as in education.
Strong growth in the oil and manufacturing investments
Investments in oil and gas extraction increased by more than 8 per cent from the second to the third quarter, and investments in manufacturing rose almost by 20 per cent. Increased investments in the machinery and other equipment industry as well as chemical and mineral products explain most of the growth.
There has been a strong growth in the investments in dwellings for some time, so far in 2006 this has been stabilised below 1 per cent. In the third quarter, the growth was 0.7 per cent.
Exports of traditional goods still growing
There was a strong growth in the exports of the traditional goods during both the second and the third quarters this year. Increase in the export of machinery and other equipment explains most of the growth in the third quarter. Total exports decreased by 0.5 per cent and this were mainly due to lower export of services.
There has been a continuous expansion in the import of the traditional commodities since the end of 2002. The increase in imports from the second to the third quarter applies to most of the commodity groups, but is especially strong in the case of the office equipment, data machines and vehicles. Import of services increased by 2.3 per cent, and higher import of business services was the main factor behind this development.
For more information on foreign economy, click here .
Revised figures for first and second quarters of 2006
Figures for the quarterly national accounts are calculated on the basis of preliminary information. New information is continuously incorporated in the calculations, and this may cause revisions in the data already published. In addition to this, a major revision of the national accounts figures is carried out periodically. Statistics Norway has today published the results of this revision with the back recalculation of the data series to 1970. For more information see http://www.ssb.no/english/subjects/09/01/nr_en/ . This means for one thing that the level of the GDP is adjusted upwards, while the growth of the volume rates is not affected. Quarterly figures are adjusted in accordance with the annual figures, and the major revision can therefore result in a minor revision of the seasonal pattern.
| Revised figures of final expenditure and gross domestic product. Percentage change in volume |
| 2005 | 1. quarter 2006 | 2. quarter 2006 | |||||||||||||||||||||||||||||||||||||
|---|---|---|---|---|---|---|---|---|---|---|---|---|---|---|---|---|---|---|---|---|---|---|---|---|---|---|---|---|---|---|---|---|---|---|---|---|---|---|---|
| New result | Former result | Seasonally adjusted figures | Unadjusted figures | Seasonally adjusted figures | Unadjusted figures | ||||||||||||||||||||||||||||||||||
| Percentage change in volume from the previous period | Percentage change in volume from the same period in the previous year | Percentage change in volume from the previous period | Percentage change in volume from the same period in the previous year | ||||||||||||||||||||||||||||||||||||
| New result | Former result | New result | Former result | New result | Former result | New result | Former result | ||||||||||||||||||||||||||||||||
| Gross domestic product | 2.4 | 2.3 | 0.7 | 0.6 | 6.0 | 5.6 | 0.5 | 0.5 | -0.1 | -0.5 | |||||||||||||||||||||||||||||
| Mainland Norway | 4.1 | 3.7 | 0.9 | 0.8 | 8.5 | 7.3 | 1.1 | 1.1 | 1.4 | 0.5 | |||||||||||||||||||||||||||||
| Household final consumtion expenditure | 3.1 | 3.2 | 1.9 | 2.0 | 4.7 | 4.7 | 1.5 | 0.6 | 3.2 | 3.0 | |||||||||||||||||||||||||||||
| Final consumption of general government | 1.8 | 1.5 | 0.7 | 0.3 | 6.2 | 6.3 | 0.2 | 0.7 | -2.8 | -2.4 | |||||||||||||||||||||||||||||
| Gross fixed capital formation | 11.2 | 10.9 | -7.4 | -8.4 | 10.2 | 7.7 | 6.2 | 5.4 | 10.7 | 9.1 | |||||||||||||||||||||||||||||
| Exports | 0.6 | 0.7 | -0.5 | 1.2 | 3.9 | 5.8 | 0.9 | -0.2 | -1.7 | -0.6 | |||||||||||||||||||||||||||||
| Imports | 8.6 | 7.4 | -0.7 | 0.4 | 13.7 | 12.8 | 3.8 | 3.4 | 6.6 | 6.4 | |||||||||||||||||||||||||||||
The unadjusted GDP growth rate for mainland Norway is now revised upwards by 1.2 and 0.9 percentage points for the first and the second quarters of 2006 respectively. This is mainly due to the revisions in certain service industries. Total GDP growth compared with the same period last year is adjusted upwards by 0.4 percentage points for both the first and the second quarters. Growth in the gross fixed capital formation is also adjusted upwards by 2.5 and 1.6 percentage points for the first and second quarters respectively. Growth in the household expenditure is almost unchanged.
| GDP figures. Seasonally adjusted |
| Percentage change in volume from the previous quarter | |||||||||||||||||||||||||||||||||||||||
|---|---|---|---|---|---|---|---|---|---|---|---|---|---|---|---|---|---|---|---|---|---|---|---|---|---|---|---|---|---|---|---|---|---|---|---|---|---|---|---|
| 2005 | 2006 | ||||||||||||||||||||||||||||||||||||||
| 2nd quarter | 3rd quarter | 4th quarter | 1st quarter | 2nd quarter | 3rd quarter | ||||||||||||||||||||||||||||||||||
| Sweden | 0.8 | 1.3 | 0.9 | 1.4 | 1.3 | 1.0 | |||||||||||||||||||||||||||||||||
| Denmark | 1.4 | 0.8 | 0.4 | 0.9 | 1.8 | 0.6 | |||||||||||||||||||||||||||||||||
| Finland | 0.1 | 1.5 | 1.0 | 2.1 | 1.9 | ||||||||||||||||||||||||||||||||||
| Germany | 0.3 | 0.5 | 0.3 | 0.8 | 1.1 | 0.6 | |||||||||||||||||||||||||||||||||
| France | -0.1 | 0.8 | 0.2 | 0.5 | 1.2 | 0.0 | |||||||||||||||||||||||||||||||||
| UK | 0.4 | 0.6 | 0.7 | 0.7 | 0.7 | 0.7 | |||||||||||||||||||||||||||||||||
| USA | 0.8 | 1.0 | 0.4 | 1.4 | 0.6 | 0.5 | |||||||||||||||||||||||||||||||||
Introducing new data for a new quarter can change seasonal adjusted data backwards, although there have not been revisions in the unadjusted figures.
Tables
Contact
-
Pål Sletten
E-mail: pal.sletten@ssb.no
tel.: (+47) 99 29 06 84
-
Ingunn Sagelvmo
E-mail: ingunn.sagelvmo@ssb.no
tel.: (+47) 40 90 26 32
-
Pia Tønjum
E-mail: pia.tonjum@ssb.no
tel.: (+47) 48 99 12 07
-
Kristian Gimming
E-mail: kristian.gimming@ssb.no
tel.: (+47) 91 88 39 06