Content
Published:
This is an archived release.
Significant growth in Norwegian economy
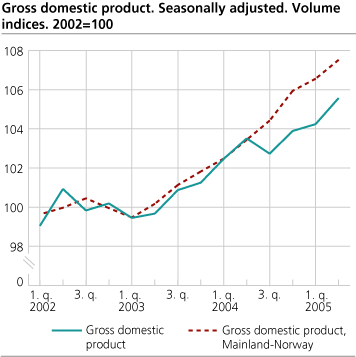
The Gross Domestic Product (GDP) for mainland Norway continued to grow in the second quarter of 2005, mainly driven by increased total household demand and oil and gas investment.
According to preliminary figures, real GDP for mainland Norway rose by 0.9 per cent in the second quarter of 2005 following an increase of 0.6 per cent in the previous quarter. The main driving force behind the development in the second quarter was increased activity in domestic trade, financial services and construction.
Following a weak increase in total GDP in the first quarter, GDP rose by 1.3 per cent in the second quarter of 2005.
GDP figures for some of Norway's trade partners.
Increase in manufacturing
Gross value added for manufacturing increased in the second quarter of 2005. The development has been positive in the publishing and reproduction industry and in the machinery industry. On the other hand, the metal industry has experienced lower growth.
Growth in household consumption
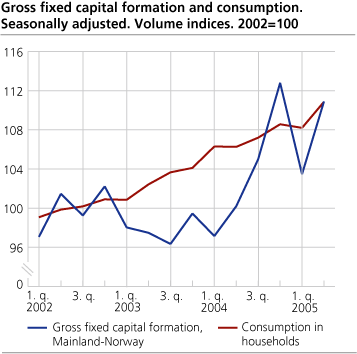
According to preliminary seasonally adjusted volume figures, final household consumption expenditure increased by 2.5 per cent in the second quarter of 2005, following a 0.3 per cent decrease in the first quarter. This is primarily due to a strong increase in household consumption of clothing and footwear, cars and furnishing and household equipment. Direct purchases abroad by resident households increased substantially in the same period. The volume of direct purchases abroad by resident households so far this year is up 18 per cent compared with the previous year. Total household consumption expenditure increased by 2.6 per cent from the first half of 2004 to the first half of 2005.
| Gross domestic product 1. quarter 2004 to 2. quarter 2005. Percentage change in volume from the previous period (seasonally adjusted) |
| 2003 | 2004 | 1. quarter 2004 | 2. quarter 2004 | 3. quarter 2004 | 4. quarter 2004 | 1. quarter 2005 | 2. quarter 2005 | ||||||||||||||||||||||||||||||||
|---|---|---|---|---|---|---|---|---|---|---|---|---|---|---|---|---|---|---|---|---|---|---|---|---|---|---|---|---|---|---|---|---|---|---|---|---|---|---|---|
| Gross domestic product (GDP) | 0.4 | 2.9 | 1.2 | 1.0 | -0.8 | 1.1 | 0.3 | 1.3 | |||||||||||||||||||||||||||||||
| Mainland-Norway | 0.7 | 3.5 | 0.6 | 0.9 | 1.0 | 1.5 | 0.6 | 0.9 | |||||||||||||||||||||||||||||||
| Petroleum activities and ocean transport | -1.0 | 0.4 | 3.4 | 1.3 | -7.5 | -0.3 | -0.7 | 2.9 | |||||||||||||||||||||||||||||||
| Final domestic use of goods and services | 0.4 | 5.9 | 3.2 | 1.9 | 0.7 | 2.8 | -0.3 | 2.2 | |||||||||||||||||||||||||||||||
| Final consumption exp. of households and NPISHs | 2.8 | 4.3 | 2.1 | 0.0 | 0.9 | 1.3 | -0.3 | 2.5 | |||||||||||||||||||||||||||||||
| Final consumption exp. of general government | 1.4 | 2.3 | 1.5 | 0.8 | -0.3 | 0.4 | 1.1 | 0.4 | |||||||||||||||||||||||||||||||
| Gross fixed capital formation | -2.0 | 9.1 | 6.3 | 2.4 | 5.3 | 10.5 | -9.3 | 10.9 | |||||||||||||||||||||||||||||||
| Exports | 1.6 | 0.9 | -1.4 | -0.3 | -0.9 | -1.1 | -0.9 | 1.7 | |||||||||||||||||||||||||||||||
| Imports | 2.2 | 9.1 | 3.3 | 1.8 | 3.5 | 3.0 | -3.2 | 4.7 | |||||||||||||||||||||||||||||||
| Total employed | -0.6 | 0.2 | -0.2 | 0.5 | 0.1 | 0.0 | 0.1 | 0.1 | |||||||||||||||||||||||||||||||
| Total man-hours worked | -1.2 | 2.0 | 1.1 | 0.3 | 0.8 | 0.5 | 0.2 | 0.6 | |||||||||||||||||||||||||||||||
| Revised figures of final expenditure and gross domestic product for 1st quarter 2005. Percentage change in volume |
| Seasonally adjusted figures | Unadjusted figures | ||||||||||||||||||||||||||||||||||||||
|---|---|---|---|---|---|---|---|---|---|---|---|---|---|---|---|---|---|---|---|---|---|---|---|---|---|---|---|---|---|---|---|---|---|---|---|---|---|---|---|
| Percentage change in volume from the previous period | Percentage change in volume from the same period in the previous year | ||||||||||||||||||||||||||||||||||||||
| 1st quarter | 1st quarter | ||||||||||||||||||||||||||||||||||||||
| New result | Former result | New result | Former result | ||||||||||||||||||||||||||||||||||||
| Gross domestic product | 0.3 | 0.5 | -0.9 | -0.8 | |||||||||||||||||||||||||||||||||||
| Mainland Norway | 0.6 | 0.9 | 0.7 | 0.9 | |||||||||||||||||||||||||||||||||||
| Household final consumtion expenditure | -0.3 | -0.2 | 0.7 | 1.0 | |||||||||||||||||||||||||||||||||||
| Final consumption of general government | 1.1 | 0.7 | -0.9 | -1.8 | |||||||||||||||||||||||||||||||||||
| Gross fixed capital formation | -9.3 | -7.4 | 8.3 | 8.3 | |||||||||||||||||||||||||||||||||||
| Exports | -0.9 | 0.8 | -4.3 | -2.7 | |||||||||||||||||||||||||||||||||||
| Imports | -3.2 | -2.4 | 2.0 | 3.0 | |||||||||||||||||||||||||||||||||||
High investments
The strong increase in gross fixed capital formation in oil and gas extraction over the past three years continued in the second quarter of 2005. A comparison of the growth rate in the first half of 2005 with the same period in the previous year shows a volume growth of more than 17 per cent. Gross fixed capital formation in oil and gas extraction accounts for more than 25 per cent of the total gross fixed capital formation in Norway.
According to seasonally adjusted figures, the investments in mainland Norway excluding general government rose in the second quarter of 2005. Investments in dwellings increased by 3.7 and 1.1 per cent in the first and second quarter of 2005 respectively.
Strong growth in imports of traditional goods
The total volume of imports of traditional goods increased by 3.3 per cent in the second quarter of 2005. The growth is mainly attributable to higher imports of computers and machinery products. Total imports increased by 4.7 per cent in the second quarter, following a decrease of 3.2 per cent from the fourth quarter of 2004 to the first quarter of this year.
The preliminary figures for the export volume of traditional goods fell by 0.8 per cent in the second quarter. The decrease is due to lower imports of basic metals and machinery products.
Weak growth in employment
Preliminary seasonally adjusted employment figures show that employment rose by 0.1 per cent in the first and the second quarter of 2005. Employment rose in construction, domestic trade and in health and social services. Total hours worked increased by 0.2 and 0.6 per cent respectively in the same period. Wages and salaries per full-time equivalents rose by 3.4 per cent from the second quarter of 2004 to the second quarter of 2005.
Revised figures for 2005
The unadjusted GDP growth for mainland Norway has been revised down by 0.2 per cent in the first quarter of 2005. This is due to lower production of services than first estimated. Hence, the growth in total GDP has also been revised down slightly. Household final consumption expenditure has been revised down by 0.3 per cent in the first quarter of 2005. Of the other macroeconomic figures, only imports and exports have significant revisions. Imports have been revised down by 1.0 per cent, while exports have been revised down by 1.6 per cent due to new information about imports and exports of services.
Tables
Contact
-
Pål Sletten
E-mail: pal.sletten@ssb.no
tel.: (+47) 99 29 06 84
-
Ingunn Sagelvmo
E-mail: ingunn.sagelvmo@ssb.no
tel.: (+47) 40 90 26 32
-
Pia Tønjum
E-mail: pia.tonjum@ssb.no
tel.: (+47) 48 99 12 07
-
Kristian Gimming
E-mail: kristian.gimming@ssb.no
tel.: (+47) 91 88 39 06