Content
Published:
This is an archived release.
Low GDP growth for mainland Norway in 2003
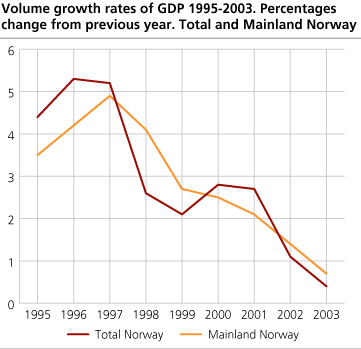
The annual national accounts show relatively low GDP (gross domestic product) growth rates for 2002 and 2003. GDP volume growth for mainland Norway was slightly higher than total GDP, with an increase of 1.41 and 0.7 per cent in 2002 and 2003 respectively.
In contrast to the preliminary figures, the volume growth rates for total GDP for Norway and for mainland Norway in 2002 were adjusted downwards by 0.3 per cent to 1.1 and 1.4 per cent respectively. The figures show that the cyclical downturn continued in 2003, with a growth in total GDP and GDP for mainland Norway of only 0.4 and 0.7 per cent. In spite of the low annual volume growth in 2003, the economy turned around in the second half of 2003, resulting in increased growth into 2004. For more information, see Quarterly national accounts .
Statistic Norway's revised national accounts are available as of 7 December:
National Accounts : National accounts, annual, final national accounts 2002 an preliminary national accounts 2003
National accounts, Institutional Sector Accounts for 2002 and preliminary accounts 2003 , quarterly national accounts for third quarter of 2004 .
Household final consumption expenditure now shows a weaker growth than previously published figures. The final figures for 2002 show volume growth of 3.1 per cent, adjusted downwards from 3.5 per cent. Preliminary figures for 2003 show a growth of 2.8 per cent against previously published 3.5 per cent. The change is mainly due to a downward adjustment in the consumption of services. Consumption of both goods and services shows a strong increase in volume growth from the second half of 2003.
Gross fixed capital formation in current prices has been adjusted upwards by NOK 5.3 billion for 2002. This means a 1.01 per cent decrease in volume growth instead of 3.4 per cent as showed in the previous figures. The revision is mainly due to higher investment in mainland Norway. Both manufacturing and other industries producing goods showed higher investment growth, but the strong growth in investments in the service industry is the main cause of the increase. For mainland Norway this resulted in a 2.5 per cent increase, while the preliminary figures showed a decrease of 2.5 per cent. The 2002 revision also results in revisions of the preliminary figures for 2003 for gross fixed capital formation. Instead of a decrease of 3.7 per cent, the new figures show a decrease of 2.0 per cent.
The number of employed persons increased by 2400 or 0.1 per cent in 2002, compared with previously published figures that showed an increase of 0.3 per cent. Equally, the number of hours worked has been adjusted from a decrease of 0.9 per cent to a decrease of 1.1 per cent. The growth in wages and salaries per full-time equivalent employee was calculated at 5.3 per cent. In 2003, the number of employed persons decreased by 0.6 per cent. The decline in employed persons for 2003 corresponds to 13 300 people. Hours worked decreased by 1.2 per cent in 2003 and the growth in wages and salaries per full-time equivalent employee was estimated at 3.9 per cent for 2003, which is the same as previously published.
Uncertainty of the estimates
The national accounts figures for 2002 have now been finalized. Some new annual structural business statistics (SBS) have been made available for the calculation of the national accounts for 2002. A wider and more comprehensive set of data is available for the final accounts as compared to the preliminary accounts.
The quality of the new data collection system from local government (KOSTRA) is assumed to have increased due to more experience with the system. In addition, there has been increased focus on integrating figures from the "new" health enterprises.
The results for 2003 are based on the quarterly national accounts, and the data are of varying quality. The basis of constant price calculations has been shifted to 2002.
| 1 | The figures were corrected 9 December 2004 at 1420. |
The statistics is now published as National accounts.
Additional information
Special tables for experienced users:
Contact
-
Statistics Norway's Information Centre
E-mail: informasjon@ssb.no
tel.: (+47) 21 09 46 42

