Content
Published:
This is an archived release.
Slight upswing in mainland economy
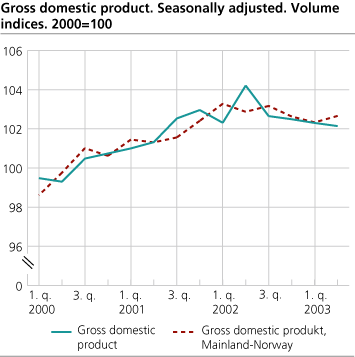
New preliminary seasonally adjusted figures from the quarterly national accounts show that GDP for mainland Norway increased by 0.3 per cent in the 2 n d quarter of 2003, following an equivalent decrease in the previous quarter. Due to lower activity in the petroleum and shipping industries total GDP dropped 0.1 per cent in the 2nd, the 4 t h subsequent quarter with a reduced GDP.
Growth in services and reduction in manufacturing
The value added in market producing services went up 0.9 per cent in the 2 n d quarter and in general government the growth is estimated at 0.3 per cent. Among the service industries with the strongest growth we find wholesale and retail trade, business services and other personal services.
On the other hand the preliminary figures show a decline in value added in manufacturing and mining throughout the 2 n d half of 2002 and the 1 s t half of 2003. The quarterly growth rates in the 1 s t and 2 n d quarters this year were -2.1 and -1.4 per cent respectively.
Increase in final consumption among households
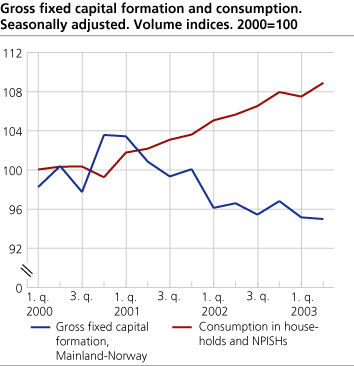
According to the most recent figures, final consumption expenditures among households and Non-Profit Institutions Serving Households (NPISH) grew by 1.3 per cent from the 1st quarter to the 2nd quarter of 2003, following growth rates of 1.3 and -0.4 per cent the previous two quarters. Consumptions of both goods and services show an upturn swing with growth rates at 2.4 and 0.7 per cent in the 2 n d quarter. Expenditures on clothes, furniture and household equipments contributed the most to the growth. The final consumption expenditure in general government had an increase of 0.8 per cent, more strongly in the local government than in the central government.
Continued low investment activity
The seasonally adjusted figures show a continued slow development in gross fixed capital formation in mainland Norway. The growth rates in the 1st quarter and in the 2nd quarter were -1.7 and -0.2 per cent respectively. The figures show differences in the development among different mainland industries. While an increase in the investment activities occurred within manufacturing and general government, the market producing service industries showed a clear decrease in investments.
Gross capital formation within the oil and gas extraction industries, including pipeline transport, increased at a steady rate of about 6.5 per cent in both the 1 s t and in the 2nd quarter of 2003.
Growth in exports of traditional goods
According to seasonally adjusted figures, the volume of exports of traditional goods increased by 4.7 per cent from the 1st quarter to the 2nd quarter, after having decreased the two previous quarters. The recent rise in exports can be observed particularly in energy intensive industries producing chemical raw materials, chemical and mineral products and metals. Also exports of refined oil products went up. The growth in exports of crude oil and natural gas was modest in the 2nd quarter with a 1.7 per cent higher volume than in the 1 s t quarter.
The preliminary figures for the volume of imports of traditional goods showed a decline of 0.3 percent from the 4 t h quarter 2002 to the 1 s t quarter 2003, followed by an increase of 1.0 per cent from the 1st to the 2nd quarter. Due to reduced imports of ships and services, total imports decreased by 2.3 per cent in the 2 n d quarter of 2003. Among the services, travel expenditures of residents travelling abroad made a strong contribution to the negative development, following a strong positive contribution the previous quarter.
| Gross domestic product 2. quarter 2002 to 2. quarter 2003. Percentage change in volume from the previous period (seasonally adjusted) |
| 2001 | 2002 | 2nd quarter 2002 | 3rd quarter 2002 | 4th quarter 2002 | 1st quarter 2003 | 2nd quarter 2003 | |||||||||||||||||||||||||||||||||
|---|---|---|---|---|---|---|---|---|---|---|---|---|---|---|---|---|---|---|---|---|---|---|---|---|---|---|---|---|---|---|---|---|---|---|---|---|---|---|---|
| Gross domestic product (GDP) | 1,9 | 1,0 | 1,9 | -1,5 | -0,2 | -0,2 | -0,1 | ||||||||||||||||||||||||||||||||
| Mainland-Norway | 1,7 | 1,3 | -0,4 | 0,3 | -0,5 | -0,3 | 0,3 | ||||||||||||||||||||||||||||||||
| Petroleum activities and ocean transport | 2,7 | 0,0 | 8,9 | -6,6 | 0,9 | 0,1 | -1,6 | ||||||||||||||||||||||||||||||||
| Final domestic use of goods and services | 0,4 | 2,1 | 1,0 | -0,9 | 1,2 | 1,3 | -2,4 | ||||||||||||||||||||||||||||||||
| Final consumption exp. of households and NPISHs | 2,6 | 3,6 | 0,6 | 0,8 | 1,3 | -0,4 | 1,3 | ||||||||||||||||||||||||||||||||
| Final consumption exp. of general government | 2,7 | 3,2 | -3,1 | 2,3 | -0,2 | 0,3 | 0,8 | ||||||||||||||||||||||||||||||||
| Gross fixed capital formation | -4,2 | -3,6 | 7,3 | -6,9 | 6,6 | -1,1 | -4,0 | ||||||||||||||||||||||||||||||||
| Exports | 4,1 | -0,5 | 5,4 | -3,4 | -1,2 | -1,9 | 2,6 | ||||||||||||||||||||||||||||||||
| Imports | 0,9 | 1,7 | 5,3 | -3,1 | 2,1 | 1,4 | -2,3 | ||||||||||||||||||||||||||||||||
| Total employed (per cent change from the same quarter previous year) | 0,5 | 0,2 | 0,6 | 0,3 | -0,5 | -0,6 | -1,0 | ||||||||||||||||||||||||||||||||
Tables
Contact
-
Pål Sletten
E-mail: pal.sletten@ssb.no
tel.: (+47) 99 29 06 84
-
Ingunn Sagelvmo
E-mail: ingunn.sagelvmo@ssb.no
tel.: (+47) 40 90 26 32
-
Pia Tønjum
E-mail: pia.tonjum@ssb.no
tel.: (+47) 48 99 12 07
-
Kristian Gimming
E-mail: kristian.gimming@ssb.no
tel.: (+47) 91 88 39 06


