Content
Published:
This is an archived release.
Moderate growth in GDP for Mainland Norway
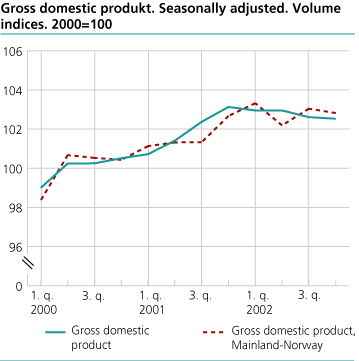
New preliminary seasonally adjusted figures from the quarterly national accounts show slight increases in gross domestic product (GDP) for Mainland Norway throughout the four quarters 2002. Annual growth was calculated at 1.3 per cent.
In addition to the current QNA, Statistics Norway is concurrently publishing QNA for the period from 1991 to 2002. For the years 1991 to 1999, the sums of the quarterly figures for each year are equal to the corresponding figures from the annual national accounts published in June of 2002 as a part of the revision of figures for the national accounts. More information on the revision of figures can be found in Economic Survey 2/2002 . The quarterly figures for 2000 have, by the same method, been adjusted to sum up to the annual final national accounts for 2000, also published today. The quarterly and annual figures released today for 2001 and 2002 are preliminary account figures.
High consumption expenditure
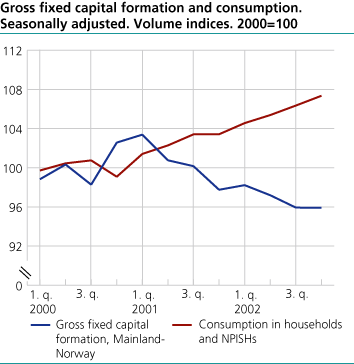
The seasonally adjusted volume figures show that the growth in consumption expenditures for households and non-profit institutions serving households increased through the last half of 2002. The quarterly growths for the 3 r d and 4 t h quarters were 0.7 and 1.6 per cent respectively. For 2002 as a whole, the calculated growth is 3.3 per cent. For 2000 and 2001 the year on year growths were 3.9 and 2.6 per cent respectively.
The annual growth in the volume of total government consumption expenditure in 2002 is estimated at 4.5 per cent. The increase in growth was particularly due to intermediate consumption that is, purchase of goods and services connected to current operations, in the health and social services. In 2002, the responsibility for specialist health services was transferred from the local government to the central government. As a result of this reform, significant uncertainties in the distribution between government consumption expenditure and investments in fixed capital in the general government have occurred in the preliminary figures for 2002. An annual growth in the total investments in fixed capital for general government was calculated at 0.1 per cent. The volume growths in total government consumption expenditure were 1.3 and 2.7 per cent in 2000 and 2001 respectively.
Diminishing investment in fixed capital activity in Mainland Norway
The seasonally adjusted figures show that investments in fixed capital in Mainland Norway have fallen more or less consistently throughout 2002. The figures for investments associated with the construction of housing show a clear downward tendency in the last half of the previous year. The investments in fixed capital in the service industries, excluding general government, have stabilised in the last half of 2002, after a continuous decrease throughout 2001 and the first half of 2002. The aforementioned decrease for the service industries, excluding general government, contributed to a reduction of 4,2 per cent in the annual total investment in fixed capital for Mainland Norway from 2001 to 2002. For 2000 and 2001, the growth was -1.2 and 0.7 per cent respectively. The preliminary figures show investments in oil and gas extraction, together with transport via pipelines, fell 4.4 per cent from 2001 to 2002.
Decrease in export of traditional goods at the end of the previous year
The preliminary figures show a decrease in the export of traditional goods over the last half of 2002. Figures for the 3 r d and 4 t h quarter are estimated to have decreased by 0.5 and 3.5 from the previous quarter. Machinery and other equipment and metals had particularly weak development in the last half of 2002. For 2002 as a whole, export of traditional goods show an increase of 1.3 per cent from 2001. If one removes export of used fixed assets, export not connected to domestic production, the annual growth rate becomes 0.9 per cent. The annual growth in the export of traditional goods for 2000 and 2001 are 2.5 and 3.7 per cent. In 2002, the volume in export of oil and gas was nearly the same as the volume in 2001.
The preliminary national account figures show an increase in import of traditional goods through the last half-year. The quarterly growth rates for 3 r d and 4 t h quarter were 1.6 and 3.3 respectively. The annual growth was 4.7 per cent. The growth in 2000 and 2001 were 2.7 and 2.9 per cent.
Slight growth in GDP for Mainland- Norway
The preliminary figures show that the GDP for Mainland Norway have only increased slightly through the previous year. For the 1 s t , 2 n d , 3 r d and 4 t h quarters, quarterly growths were 0.3, 0.0, 0.3, 0.0 per cent respectively. A reduction of 0.1 per cent occurred from the 3 r d to 4 t h quarter of 2002. Value added within manufacturing and the mining industries fell by 1.2 and 1.6 per cent in the 3 r d and 4 t h quarters respectively, of 2002. The growth in value added in the service industries, excluding general government, have remained even over the last three years. The annual growth rate for the years 2000, 2001 and 2002 were 4.9, 3.2 and 1.9 per cent respectively. The growth rates for GDP for Mainland Norway were 2.5, 1.7 and 1.3 per cent. In 2002, the annual growth in total GDP was 1.0 per cent.
Lessened growth in employed persons
For the number of employed persons and hours worked, only the preliminary non-seasonally adjusted figures from the quarterly national accounts are available. The preliminary unadjusted figures for the total number of employed persons show a decrease of 0.6 per cent for the 4 t h quarter as compared to the 4 t h quarter of 2001. In the 3 r d quarter there was an increase of 0.4 per cent. A growth of 0.3 per cent was calculated for the entire year 2002. Industry experienced a decrease of 1.2 per cent, while employment in general government increased by 1.3 per cent. Total hours worked decreased by 1.0 per cent last year. This reduction should be considered with regards to the introduction of two extra vacation days for most employed persons. Increased absences and reduced overtime hours also contributed to the decrease. Annual growth in salaries and wages per normal full-time equivalent person was estimated at 5.3 per cent for 2002.
Increase in operating surplus for Mainland Norway
The preliminary figures from the quarterly national accounts estimate the 2002 total operating surplus for Mainland Norway at 254.3 billion NOK in current values. This is an increase of 24.3 billion or 10.6 per cent from 2001. The growth in total compensation of employees for Mainland Norway from 2001 was 35 billion (5.4 per cent).
| Gross domestic product 1. to 4. quarter 2002. Percentage change in volume from the previous period (seasonally adjusted) |
| 2001 | 2002 | 1. quarter 2002 | 2. quarter 2002 | 3. quarter 2002 | 4. quarter 2002 | ||||||||||||||||||||||||||||||||||
|---|---|---|---|---|---|---|---|---|---|---|---|---|---|---|---|---|---|---|---|---|---|---|---|---|---|---|---|---|---|---|---|---|---|---|---|---|---|---|---|
| Gross domestic product (GDP) | 1,9 | 1,0 | -0,5 | 0,8 | -0,6 | 0,2 | |||||||||||||||||||||||||||||||||
| Mainland-Norway | 1.7 | 1.3 | 0.3 | 0.0 | 0.3 | 0.0 | |||||||||||||||||||||||||||||||||
| Petroleum activities and ocean transport | 2.7 | 0.0 | -2.7 | 3.2 | -3.4 | 0.9 | |||||||||||||||||||||||||||||||||
| Final domestic use of goods and services | 0.4 | 2.1 | 2.4 | -0.3 | -0.2 | 2.0 | |||||||||||||||||||||||||||||||||
| Final consumption exp. of households and NPISHs | 2.6 | 3.3 | 1.3 | 0.4 | 0.7 | 1.6 | |||||||||||||||||||||||||||||||||
| Final consumption exp. of general government | 2.7 | 4.5 | 3.0 | -1.1 | 1.5 | 0.2 | |||||||||||||||||||||||||||||||||
| Gross fixed capital formation | -4.2 | -3.3 | -1.8 | 5.6 | -6.3 | 2.6 | |||||||||||||||||||||||||||||||||
| Exports | 4.1 | -0.5 | -5.7 | 4.9 | -2.5 | -1.4 | |||||||||||||||||||||||||||||||||
| Imports | 0.9 | 1.7 | -1.4 | 4.4 | -2.5 | 2.6 | |||||||||||||||||||||||||||||||||
| Total employed (percent change from the same quarter previous year) | 0.5 | 0.3 | 0.7 | 0.6 | 0.4 | -0.6 | |||||||||||||||||||||||||||||||||
Revisions for 2000 and 2001
The annual growth in GDP for Mainland Norway has been adjusted upwards from 1.9 to 2.5 per cent in the final national accounts for 2000, and the annual growth in the preliminary accounts for 2001 has been adjusted upwards from 1.2 to 1.7 per cent. These adjustments are primarily due to the incorporation of detailed and final structure statistics into the calculation of the final annual accounts. In addition, the calculations are carried out on a more detailed level in the annual accounts than in the quarterly national accounts. The preliminary figures for 2001are based upon information from preliminary structure statistics. Value added in industry and in wholesale and retail trade have been adjusted with an increase in both years, in relation to the publication in June of 2002.
Tables
Contact
-
Pål Sletten
E-mail: pal.sletten@ssb.no
tel.: (+47) 99 29 06 84
-
Ingunn Sagelvmo
E-mail: ingunn.sagelvmo@ssb.no
tel.: (+47) 40 90 26 32
-
Pia Tønjum
E-mail: pia.tonjum@ssb.no
tel.: (+47) 48 99 12 07
-
Kristian Gimming
E-mail: kristian.gimming@ssb.no
tel.: (+47) 91 88 39 06


