Content
Published:
This is an archived release.
Slow growth in GDP for Mainland-Norway
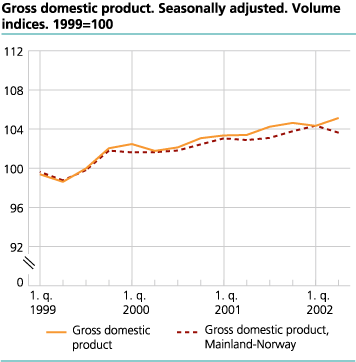
New preliminary figures from the quarterly national accounts show that the gross domestic product for Mainland-Norway increased by 1.0 per cent from the first half of 2001 to the first half 2002. The seasonally adjusted figures show growth in the first quarter and a reduction of an approximately equivalent amount in the second quarter. The total value added for the manufacturing industries in the first half-year was calculated to be on the same level as for the second half of the previous year, 2001.
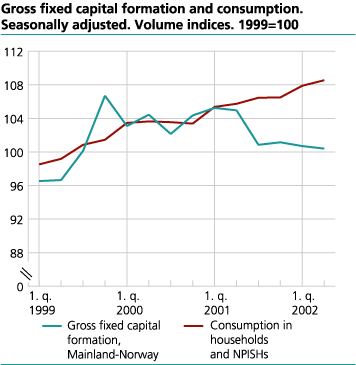
The fact that Easter and thereby the spring holidays were in March this year produced significant uncertainties in the seasonally adjusted figures for the 1 s t and 2 n d quarters. According to the preliminary volume figures, consumption by households and non-profit institutions serving households (NPISH) increased by 0.6 per cent from the 1 s t quarter to the 2 n d quarter after increasing by 1.3 per cent from the 4 t h quarter of 2001 to the 1 s t quarter of 2002. The quarterly growth rates (the percent change from the previous quarter in the seasonally adjusted volume figures) for total general government consumption expenditures for the 1 s t and 2 n d quarters were estimated at 1.3 and 1.0 per cent respectively.
Continued low investment activity
The new preliminary figures indicate a slight decrease in the gross investments in fixed capital for Mainland-Norway for the first half-year 2002. The quarterly growth rate is estimated at -0.4 and -0.3 per cent for the 1 s t and 2 n d quarters. It is primarily the investments in the service industries excluding general government that led to the reduction from 1 s t to 2 n d quarter.
The seasonally adjusted national account figures for investments in Mainland-Norway showed a relatively strong decline in the second half of 2001. This provides some explanation for this figure being 4.3 per cent less in the first half of 2002 than in the first half of 2001. The investments in oil and gas extraction in addition to investments in transport via pipelines were at approximately the same level for the 2 n d quarter as for the 1 s t quarter.
Price decrease in traditional goods export
According to the preliminary figures, the volume in export of traditional goods rose by 2.7 per cent from the 1 s t to the 2 n d quarter after a fall of 2.3 per cent from 4 t h quarter 2001 to 1 s t quarter 2002. The seasonally adjusted price index for the export of traditional goods fell in both the 1 s t and 2 n d quarters. For the first 2 quarters combined, the figures indicate a decline in the prices on traditional goods for export of 9.7 per cent compared to the first half-year of 2001. The volume for the export of crude oil and natural gas gained 11.5 per cent from the 1 s t to the 2 n d quarter, after a reduction of 7.8 per cent from 4 t h quarter 2001 to 1 s t quarter 2002. The growth in this figure is primarily due to an increase in export of natural gas in the 2 n d quarter.
The seasonally adjusted figures for the volume of imported traditional goods reflect a decrease of 2.6 per cent from the 1 s t to the 2 n d quarter after an increase of 1.8 per cent from the 4 t h quarter of the previous year to the 1 s t quarter of this year. For total import, the growth rates in the 1 s t and 2 n d quarters were calculated as -3.5 and 0.5 per cent respectively.
Slow development in the value added for service industries
The seasonally adjusted national account figures show a reduction of 0.7 per cent in the gross domestic product (GDP) for Mainland-Norway from the 1 s t to 2 n d quarter of 2002, after an increase of 0.5 per cent from the 4 t h quarter 2001 to the 1 s t quarter this year. The decrease between the 1 s t and 2 n d quarters can be attributed to a drop of 1.8 per cent from 1 s t to 2 n d quarter 2002 in the service industries' figures, after a gain of 1.7 per cent from 4 t h quarter last year to 1 s t quarter this year. The preliminary figures show that value added in industry increased by 1.6 per cent from 1 s t to 2 n d quarter after a fall of 0.9 per cent from 4 t h quarter 2001 to 1 s t quarter this year. For the total gross domestic product, the growth rate in 1 s t and 2 n d quarter were estimated at -0.3 and 0.8 per cent respectively.
The 1 s t quarter GDP growth rate for Mainland-Norway was revised to 0.6 percentage points lower than the previously published figures released in June. The revision is mainly due to revisions of value added for general government and of value added for the business service industry.
Growth in number of employed persons
For employed persons and hours worked, seasonally adjusted figures are not currently available from the quarterly national accounts. The preliminary figures for total employed persons show a growth of 0.4 per cent in the 2 n d quarter over figures from the 2 n d quarter of 2001. The corresponding growth rate for the 1 s t quarter is estimated at 0.5 per cent. For industry, the annual growth rate for 2 n d quarter was estimated close to zero. For the service industries excluding general government, a small decrease was calculated. The preliminary figures show that the largest portion of the employment growth in the 2 n d quarter occurred within the general government, which according to the figures had an annual growth in employed persons of 1.8 per cent.
In the 2 n d quarter, annual hours-worked growth was estimated at 3.8 per cent, while a reduction of 6.8 per cent was calculated for the 1 s t quarter 2002 compared to the figures from the 1 s t quarter of 2001. For the first two quarters combined, the figures show a reduction of 1.8 per cent from the same period in 2001. The variation in the growth rate from 1 s t to 2 n d quarter is mainly due to the variation in the timing of Easter between the previous year and this year. The reduction for the 1 s t and 2 n d quarters combined must be considered in light of increased holiday time and increased absences.
| Gross domestic product 3. quarter 2001 to 2. quarter 2002. Percentage change in volume from the previous period (seasonally adjusted) |
| 2000 | 2001 | 3. quarter 2001 | 4. quarter 2001 | 1. quarter 2002 | 2. quarter 2002 | ||||||||||||||||||||||||||||||||||
|---|---|---|---|---|---|---|---|---|---|---|---|---|---|---|---|---|---|---|---|---|---|---|---|---|---|---|---|---|---|---|---|---|---|---|---|---|---|---|---|
| Gross domestic product (GDP) | 2.4 | 1.4 | 0.8 | 0.4 | -0.3 | 0.8 | |||||||||||||||||||||||||||||||||
| Mainland-Norway | 1.9 | 1.2 | 0.2 | 0.7 | 0.5 | -0.7 | |||||||||||||||||||||||||||||||||
| Petroleum activities and ocean transport | 4.9 | 2.5 | 3.9 | -1.1 | -4.4 | 8.4 | |||||||||||||||||||||||||||||||||
| Final domestic use of goods and services | 2.5 | -0.2 | -1.2 | 0.1 | 1.1 | -0.9 | |||||||||||||||||||||||||||||||||
| Final consumption exp. of households and NPISHs | 3.5 | 2.5 | 0.7 | 0.0 | 1.3 | 0.6 | |||||||||||||||||||||||||||||||||
| Final consumption exp of general government | 1.2 | 2.0 | 0.2 | 0.8 | 1.3 | 1.0 | |||||||||||||||||||||||||||||||||
| Gross fixed capital formation | -1.5 | -4.6 | -3.2 | 2.4 | -3.5 | 2.3 | |||||||||||||||||||||||||||||||||
| Exports | 2.9 | 4.2 | 3.3 | 2.6 | -5.8 | 4.4 | |||||||||||||||||||||||||||||||||
| Imports | 3.2 | 0.0 | -1.8 | 2.4 | -3.5 | 0.5 | |||||||||||||||||||||||||||||||||
| Total employed (percent change from the same quarter previous year) | 0.4 | 0.5 | 0.2 | 0.5 | 0.5 | 0.4 | |||||||||||||||||||||||||||||||||
Uncertainty in the calculations
The results from the quarterly national accounts are based upon calculations in which the base material is of varying quality. This is particularly relevant for the most recently published quarter.
Tables
Contact
-
Pål Sletten
E-mail: pal.sletten@ssb.no
tel.: (+47) 99 29 06 84
-
Ingunn Sagelvmo
E-mail: ingunn.sagelvmo@ssb.no
tel.: (+47) 40 90 26 32
-
Pia Tønjum
E-mail: pia.tonjum@ssb.no
tel.: (+47) 48 99 12 07
-
Kristian Gimming
E-mail: kristian.gimming@ssb.no
tel.: (+47) 91 88 39 06


